
- Start >
- Rivers >
- Discharge >
- Bayern >
- Gerolfingen >
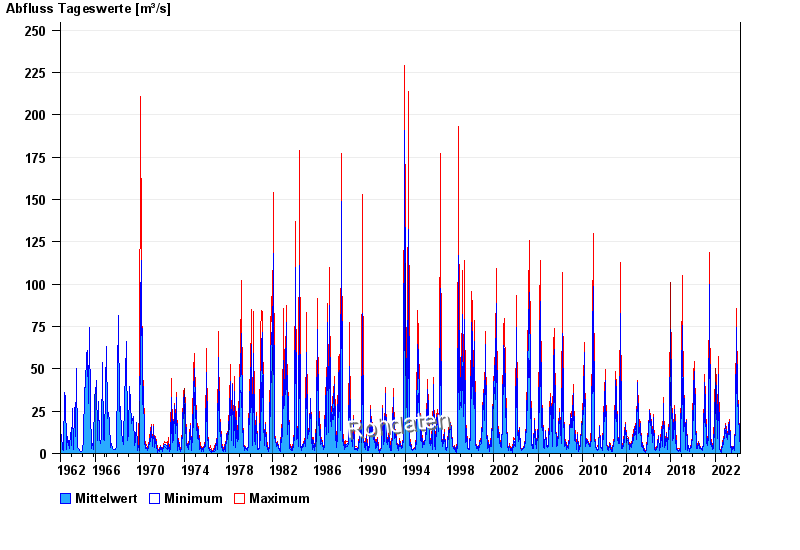
- Chart of total period

Chart of total period Gerolfingen / Wörnitz
Discharge from 01.11.1962 to 18.04.2024
| Date | Mean value [m³/s] | Maximum [m³/s] | Minimum [m³/s] |
|---|---|---|---|
| 18.04.2024 | 3.14 | 3.14 | 3.14 |
| 17.04.2024 | 3.14 | 3.14 | 3.02 |
| 16.04.2024 | 2.78 | 3.02 | 2.66 |
| 15.04.2024 | 2.55 | 2.78 | 2.44 |
| 14.04.2024 | 2.65 | 2.9 | 2.55 |
| 13.04.2024 | 2.7 | 2.78 | 2.66 |
| 12.04.2024 | 2.77 | 2.9 | 2.66 |
© Bayerisches Landesamt für Umwelt 2024