
- Start >
- Rivers >
- Discharge >
- Bayern >
- Gemünden Lachsfangsteg >
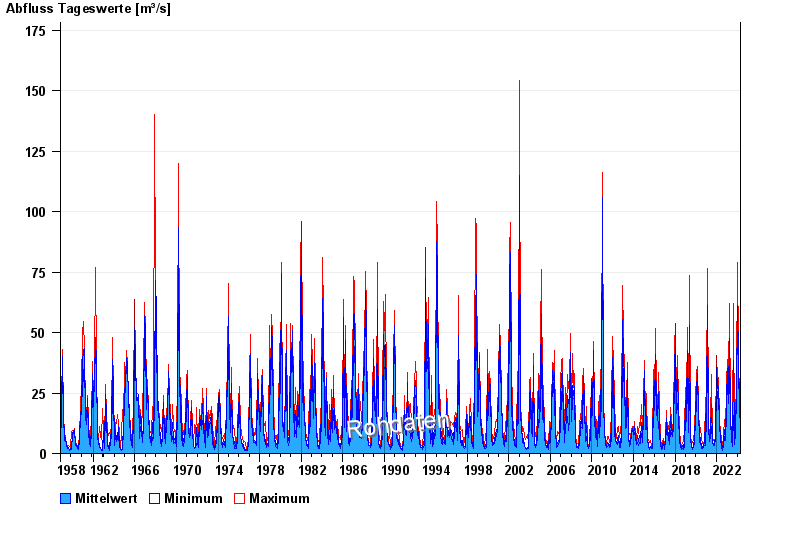
- Chart of total period

Chart of total period Gemünden Lachsfangsteg / Sinn
Discharge from 01.11.1958 to 19.04.2024
| Date | Mean value [m³/s] | Maximum [m³/s] | Minimum [m³/s] |
|---|---|---|---|
| 19.04.2024 | 8.49 | 8.6 | 8.21 |
| 18.04.2024 | 8.42 | 11.6 | 3.75 |
| 17.04.2024 | 9.85 | 11.8 | 8.4 |
| 16.04.2024 | 8.14 | 9.96 | 7.37 |
| 15.04.2024 | 7.28 | 8.6 | 4.98 |
| 14.04.2024 | 7.41 | 7.57 | 7.17 |
| 13.04.2024 | 7.6 | 7.96 | 7.57 |
© Bayerisches Landesamt für Umwelt 2024