
- Start >
- Rivers >
- Discharge >
- Bayern >
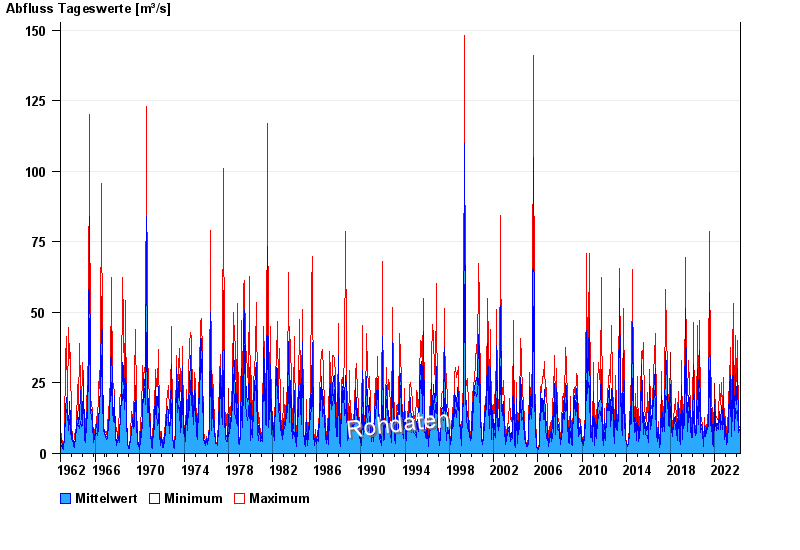
- Garmisch o. d. Partnachmündung >
- Chart of total period

Chart of total period Garmisch o. d. Partnachmündung / Loisach
Discharge from 01.11.1962 to 25.04.2024
| Date | Mean value [m³/s] | Maximum [m³/s] | Minimum [m³/s] |
|---|---|---|---|
| 25.04.2024 | 6.82 | 6.83 | 6.62 |
| 24.04.2024 | 6.66 | 6.83 | 6.62 |
| 23.04.2024 | 6.82 | 6.83 | 6.62 |
| 22.04.2024 | 6.89 | 7.05 | 6.83 |
| 21.04.2024 | 7.09 | 7.27 | 7.05 |
| 20.04.2024 | 7.37 | 7.49 | 7.05 |
| 19.04.2024 | 7.12 | 7.49 | 6.83 |
© Bayerisches Landesamt für Umwelt 2024