
- Start >
- Rivers >
- Discharge >
- Bayern >
- Gampelmühle >
- Chart of year

Chart of year Gampelmühle / Ölschnitz
Discharge from 17.08.2021 to 16.08.2022
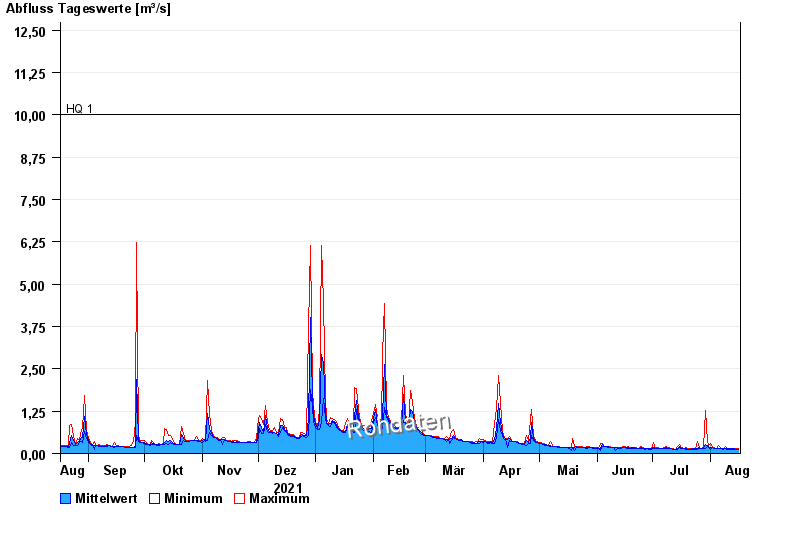
- HQ1 10 m³/s
- HQ2 13 m³/s
- HQ5 16 m³/s
- HQ10 19 m³/s
- HQ20 22 m³/s
- HQ50 26 m³/s
- HQ100 28 m³/s
| Date | Mean value [m³/s] | Maximum [m³/s] | Minimum [m³/s] |
|---|---|---|---|
| 16.08.2022 | 0.132 | 0.151 | 0.121 |
| 15.08.2022 | 0.13 | 0.14 | 0.121 |
| 14.08.2022 | 0.134 | 0.14 | 0.131 |
| 13.08.2022 | 0.138 | 0.162 | 0.131 |
| 12.08.2022 | 0.136 | 0.162 | 0.131 |
| 11.08.2022 | 0.133 | 0.14 | 0.131 |
| 10.08.2022 | 0.138 | 0.151 | 0.131 |
© Bayerisches Landesamt für Umwelt 2024