
- Start >
- Rivers >
- Discharge >
- Bayern >
- Gampelmühle >
- Chart of year

Chart of year Gampelmühle / Ölschnitz
Discharge from 01.01.2022 to 31.12.2022
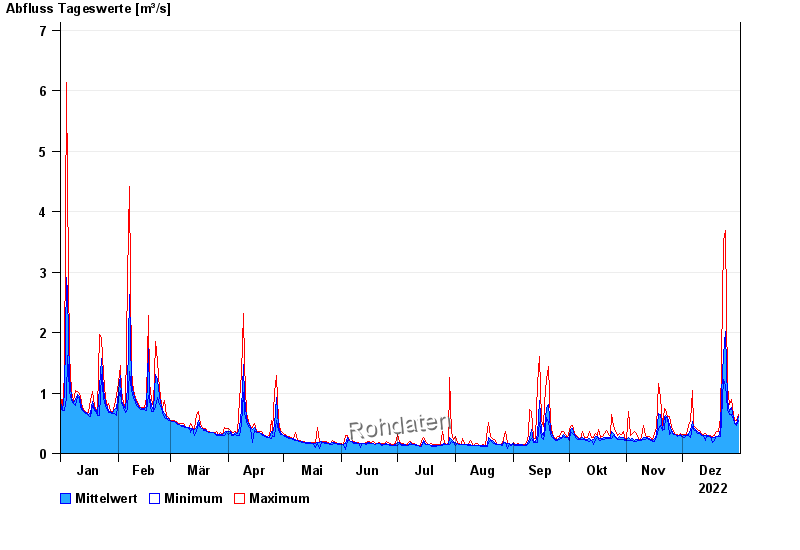
| Date | Mean value [m³/s] | Maximum [m³/s] | Minimum [m³/s] |
|---|---|---|---|
| 31.12.2022 | 0.617 | 0.648 | 0.544 |
| 30.12.2022 | 0.503 | 0.544 | 0.47 |
| 29.12.2022 | 0.517 | 0.57 | 0.496 |
| 28.12.2022 | 0.588 | 0.648 | 0.57 |
| 27.12.2022 | 0.766 | 0.896 | 0.648 |
| 26.12.2022 | 0.692 | 0.81 | 0.648 |
| 25.12.2022 | 0.884 | 1.1 | 0.726 |
© Bayerisches Landesamt für Umwelt 2024