
- Start >
- Rivers >
- Discharge >
- Bayern >
- Gampelmühle >
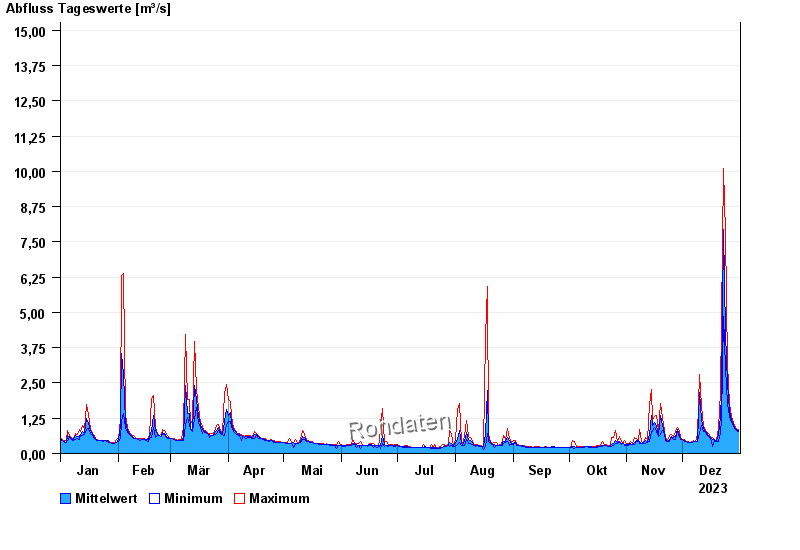
- Chart of year

Chart of year Gampelmühle / Ölschnitz
Discharge from 01.01.2023 to 31.12.2023
- 06.06.1984 Abfluss: 25,5 m³/s
- 16.08.1972 Abfluss: 20,4 m³/s
- 23.02.1970 Abfluss: 19,8 m³/s
- 26.01.1995 Abfluss: 19,7 m³/s
- 28.05.2006 Abfluss: 18,5 m³/s
| Date | Mean value [m³/s] | Maximum [m³/s] | Minimum [m³/s] |
|---|---|---|---|
| 31.12.2023 | 0.82 | 0.85 | 0.794 |
| 30.12.2023 | 0.861 | 0.879 | 0.821 |
| 29.12.2023 | 0.926 | 0.996 | 0.879 |
| 28.12.2023 | 1.02 | 1.11 | 0.965 |
| 27.12.2023 | 1.18 | 1.3 | 1.11 |
| 26.12.2023 | 1.52 | 1.78 | 1.3 |
| 25.12.2023 | 2.47 | 3.15 | 1.78 |
© Bayerisches Landesamt für Umwelt 2024