
- Start >
- Rivers >
- Discharge >
- Bayern >
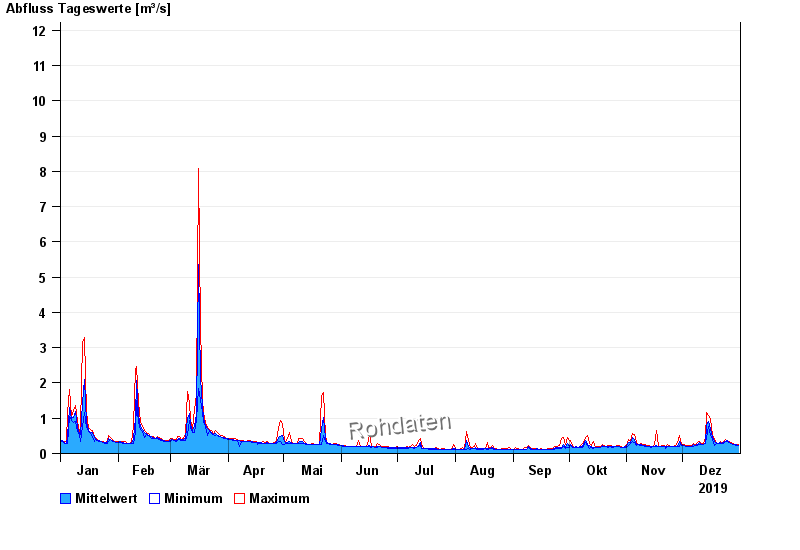
- Gampelmühle >
- Chart of year

Chart of year Gampelmühle / Ölschnitz
Discharge from 01.01.2019 to 31.12.2019
- 06.06.1984 Abfluss: 25,5 m³/s
- 16.08.1972 Abfluss: 20,4 m³/s
- 23.02.1970 Abfluss: 19,8 m³/s
- 26.01.1995 Abfluss: 19,7 m³/s
- 28.05.2006 Abfluss: 18,5 m³/s
| Date | Mean value [m³/s] | Maximum [m³/s] | Minimum [m³/s] |
|---|---|---|---|
| 31.12.2019 | 0.231 | 0.243 | 0.228 |
| 30.12.2019 | 0.242 | 0.259 | 0.228 |
| 29.12.2019 | 0.247 | 0.259 | 0.243 |
| 28.12.2019 | 0.264 | 0.276 | 0.259 |
| 27.12.2019 | 0.29 | 0.312 | 0.276 |
| 26.12.2019 | 0.32 | 0.351 | 0.312 |
| 25.12.2019 | 0.355 | 0.372 | 0.351 |
© Bayerisches Landesamt für Umwelt 2024