
- Start >
- Rivers >
- Discharge >
- Bayern >
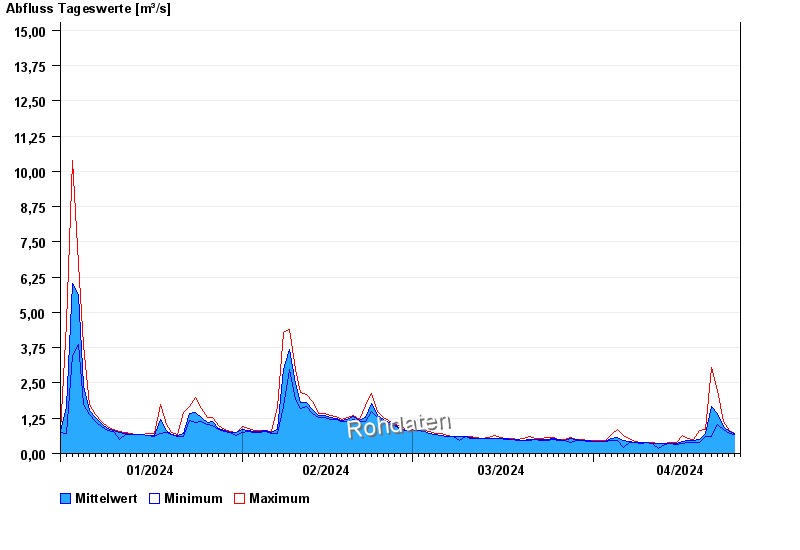
- Gampelmühle >
- Chart of year

Chart of year Gampelmühle / Ölschnitz
Discharge from 01.01.2024 to 25.04.2024
- 06.06.1984 Abfluss: 25,5 m³/s
- 16.08.1972 Abfluss: 20,4 m³/s
- 23.02.1970 Abfluss: 19,8 m³/s
- 26.01.1995 Abfluss: 19,7 m³/s
- 28.05.2006 Abfluss: 18,5 m³/s
| Date | Mean value [m³/s] | Maximum [m³/s] | Minimum [m³/s] |
|---|---|---|---|
| 25.04.2024 | 0.71 | 0.725 | 0.699 |
| 24.04.2024 | 0.777 | 0.808 | 0.725 |
| 23.04.2024 | 0.949 | 1.13 | 0.837 |
| 22.04.2024 | 1.4 | 2.22 | 1.04 |
| 21.04.2024 | 1.66 | 3.05 | 0.594 |
| 20.04.2024 | 0.707 | 0.837 | 0.62 |
| 19.04.2024 | 0.501 | 0.808 | 0.384 |
© Bayerisches Landesamt für Umwelt 2024