
- Start >
- Rivers >
- Discharge >
- Bayern >
- Gampelmühle >
- Chart of year

Chart of year Gampelmühle / Ölschnitz
Discharge from 17.08.2020 to 16.08.2021
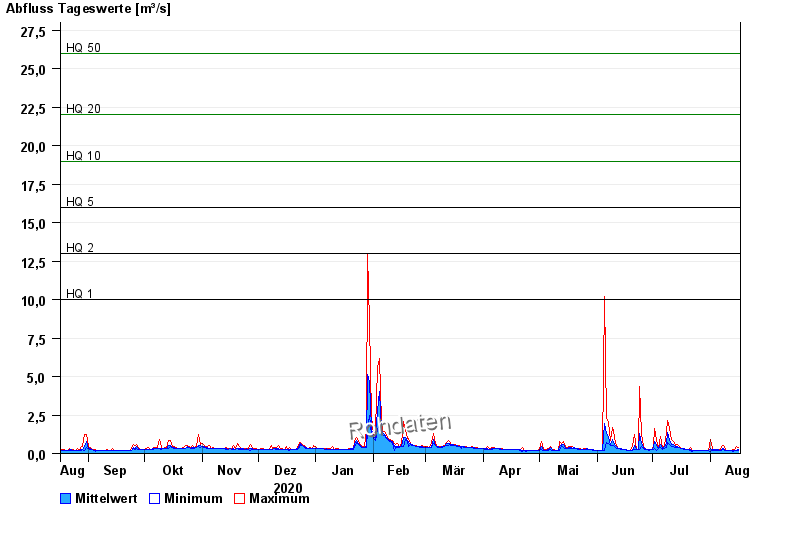
- HQ1 10 m³/s
- HQ2 13 m³/s
- HQ5 16 m³/s
- HQ10 19 m³/s
- HQ20 22 m³/s
- HQ50 26 m³/s
- HQ100 28 m³/s
| Date | Mean value [m³/s] | Maximum [m³/s] | Minimum [m³/s] |
|---|---|---|---|
| 16.08.2021 | 0.247 | 0.416 | 0.207 |
| 15.08.2021 | 0.188 | 0.436 | 0.167 |
| 14.08.2021 | 0.174 | 0.179 | 0.167 |
| 13.08.2021 | 0.178 | 0.291 | 0.099 |
| 12.08.2021 | 0.179 | 0.179 | 0.167 |
| 11.08.2021 | 0.187 | 0.193 | 0.179 |
| 10.08.2021 | 0.196 | 0.207 | 0.179 |
© Bayerisches Landesamt für Umwelt 2024