

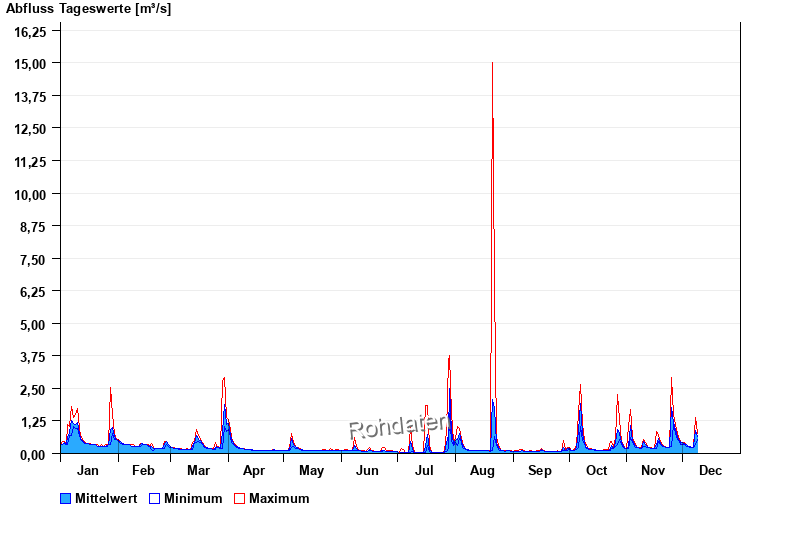
Chart of year Gaden / Schinderbach
Discharge from 01.01.2025 to 31.12.2025
note
Datenabruf nur 07:00, 15:00 und 23:00 MEZ.
Bei Hochwasser kontinuierlich.
| Date | Mean value [m³/s] | Maximum [m³/s] | Minimum [m³/s] |
|---|---|---|---|
| 09.12.2025 | 0.704 | 0.778 | 0.624 |
| 08.12.2025 | 0.902 | 1.38 | 0.347 |
| 07.12.2025 | 0.254 | 0.287 | 0.234 |
| 06.12.2025 | 0.234 | 0.234 | 0.234 |
| 05.12.2025 | 0.261 | 0.287 | 0.234 |
| 04.12.2025 | 0.287 | 0.287 | 0.287 |
| 03.12.2025 | 0.33 | 0.347 | 0.287 |
© Bayerisches Landesamt für Umwelt 2025