

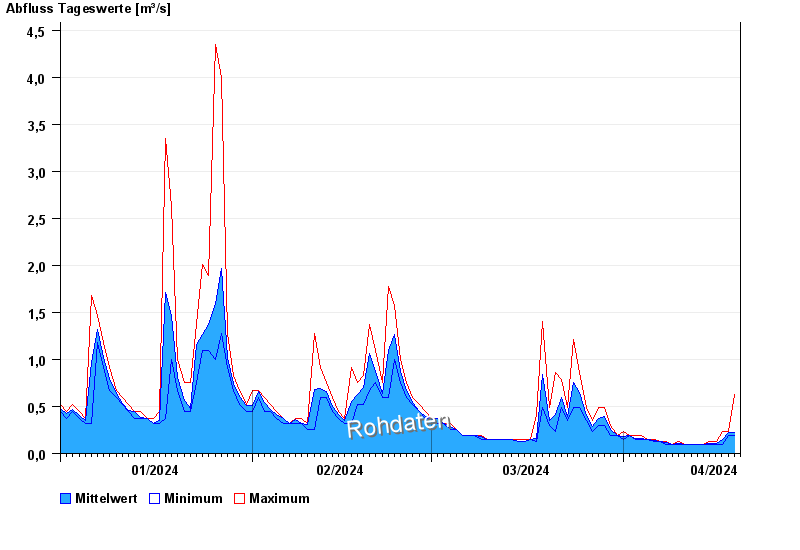
Chart of year Gaden / Schinderbach
Discharge from 01.01.2024 to 19.04.2024
note
Datenabruf nur 07:00, 15:00 und 23:00 MEZ
| Date | Mean value [m³/s] | Maximum [m³/s] | Minimum [m³/s] |
|---|---|---|---|
| 19.04.2024 | 0.215 | 0.486 | 0.192 |
| 18.04.2024 | 0.218 | 0.239 | 0.192 |
| 17.04.2024 | 0.15 | 0.239 | 0.099 |
| 16.04.2024 | 0.107 | 0.123 | 0.099 |
| 15.04.2024 | 0.108 | 0.123 | 0.099 |
| 14.04.2024 | 0.099 | 0.099 | 0.099 |
| 13.04.2024 | 0.099 | 0.099 | 0.099 |
© Bayerisches Landesamt für Umwelt 2024