
- Start >
- Rivers >
- Discharge >
- Bayern >
- Frauenkreuz >
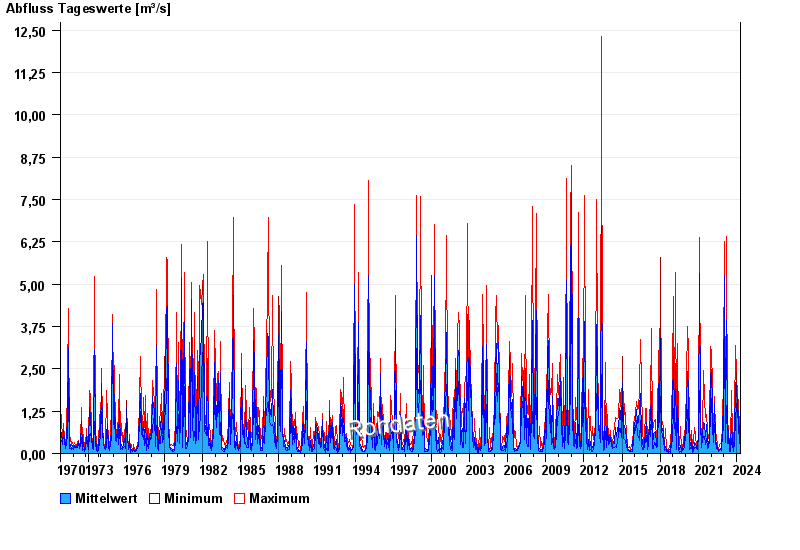
- Chart of total period

Chart of total period Frauenkreuz / Gründlach
Discharge from 01.11.1970 to 25.04.2024
| Date | Mean value [m³/s] | Maximum [m³/s] | Minimum [m³/s] |
|---|---|---|---|
| 25.04.2024 | 0.181 | 0.181 | 0.181 |
| 24.04.2024 | 0.207 | 0.234 | 0.181 |
| 23.04.2024 | 0.276 | 0.325 | 0.234 |
| 22.04.2024 | 0.474 | 0.646 | 0.342 |
| 21.04.2024 | 0.374 | 0.646 | 0.249 |
| 20.04.2024 | 0.279 | 0.309 | 0.234 |
| 19.04.2024 | 0.151 | 0.234 | 0.134 |
© Bayerisches Landesamt für Umwelt 2024