

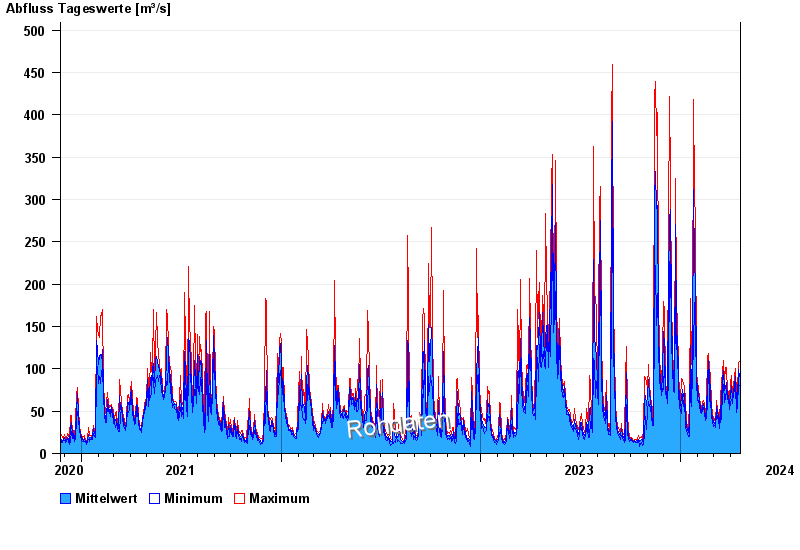
Chart of total period Ferthofen / Iller
Discharge from 24.11.2020 to 18.04.2024
 Für diesen Pegel sind keine Hauptwerte hinterlegt.
| Date | Mean value [m³/s] | Maximum [m³/s] | Minimum [m³/s] |
|---|---|---|---|
| 18.04.2024 | 106 | 107 | 105 |
| 17.04.2024 | 87.9 | 109 | 74.2 |
| 16.04.2024 | 98.9 | 106 | 81.9 |
| 15.04.2024 | 80 | 97.1 | 63.9 |
| 14.04.2024 | 65 | 73.5 | 55.6 |
| 13.04.2024 | 59.1 | 66 | 47.6 |
| 12.04.2024 | 49.2 | 53.8 | 45.8 |
© Bayerisches Landesamt für Umwelt 2024