
- Start >
- Rivers >
- Discharge >
- Bayern >
- Feldolling >
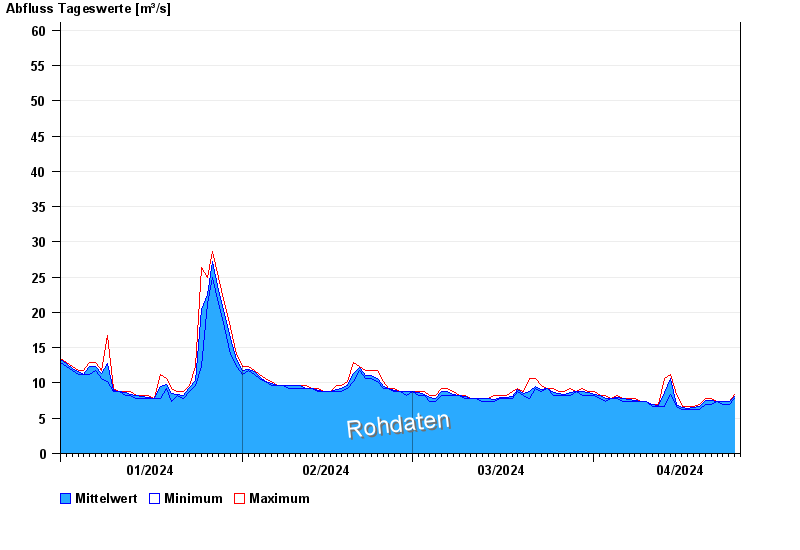
- Chart of year

Chart of year Feldolling / Mangfall
Discharge from 01.01.2024 to 25.04.2024
- HQ1 108 m³/s
- HQ2 125 m³/s
- HQ5 170 m³/s
- HQ10 200 m³/s
- HQ20 240 m³/s
- HQ50 290 m³/s
- HQ100 340 m³/s
| Date | Mean value [m³/s] | Maximum [m³/s] | Minimum [m³/s] |
|---|---|---|---|
| 25.04.2024 | 7.42 | 7.42 | 7.42 |
| 24.04.2024 | 7.36 | 7.42 | 7.01 |
| 23.04.2024 | 7.39 | 7.42 | 7.01 |
| 22.04.2024 | 7.42 | 7.42 | 7.42 |
| 21.04.2024 | 7.45 | 7.83 | 7.01 |
| 20.04.2024 | 7.45 | 7.83 | 7.01 |
| 19.04.2024 | 6.6 | 7.01 | 6.24 |
© Bayerisches Landesamt für Umwelt 2024