

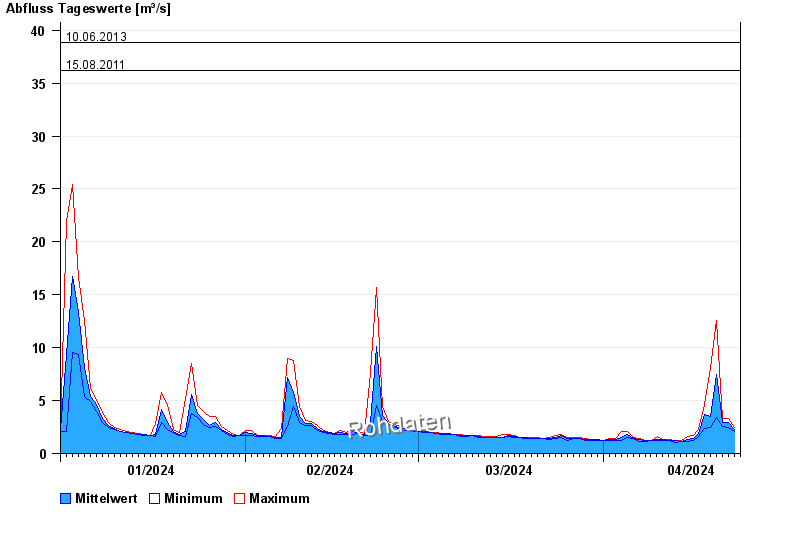
Chart of year Eschlkam / Chamb
Discharge from 01.01.2024 to 23.04.2024
- 17.05.2013 Abfluss: 52 m³/s
- 03.06.2013 Abfluss: 43,1 m³/s
- 03.06.2010 Abfluss: 40,3 m³/s
- 10.06.2013 Abfluss: 38,8 m³/s
- 15.08.2011 Abfluss: 36,2 m³/s
| Date | Mean value [m³/s] | Maximum [m³/s] | Minimum [m³/s] |
|---|---|---|---|
| 23.04.2024 | 2.28 | 2.42 | 2.17 |
| 22.04.2024 | 2.9 | 3.35 | 2.42 |
| 21.04.2024 | 2.93 | 3.35 | 2.56 |
| 20.04.2024 | 7.45 | 12.6 | 3.39 |
| 19.04.2024 | 3.5 | 8 | 2.47 |
| 18.04.2024 | 3.64 | 4.62 | 2.36 |
| 17.04.2024 | 1.88 | 2.31 | 1.6 |
© Bayerisches Landesamt für Umwelt 2024