
- Start >
- Rivers >
- Discharge >
- Bayern >
- Eschelbach Q >
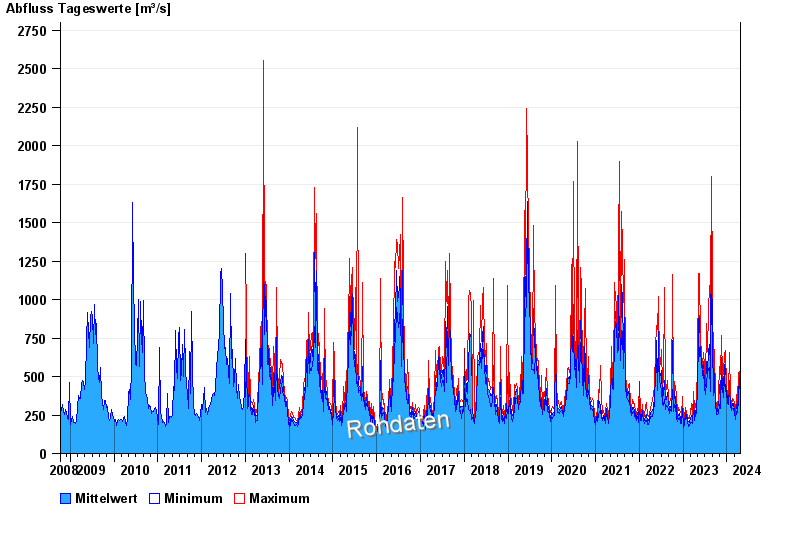
- Chart of total period

Chart of total period Eschelbach Q / Inn
Discharge from 10.10.2008 to 23.04.2024
| Date | Mean value [m³/s] | Maximum [m³/s] | Minimum [m³/s] |
|---|---|---|---|
| 23.04.2024 | 341 | 364 | 316 |
| 22.04.2024 | 322 | 343 | 301 |
| 21.04.2024 | 331 | 359 | 301 |
| 20.04.2024 | 358 | 380 | 335 |
| 19.04.2024 | 384 | 452 | 344 |
| 18.04.2024 | 458 | 476 | 447 |
| 17.04.2024 | 505 | 535 | 463 |
© Bayerisches Landesamt für Umwelt 2024