

Chart of total period Erb / Leitzach
Discharge from 27.05.1940 to 18.04.2024
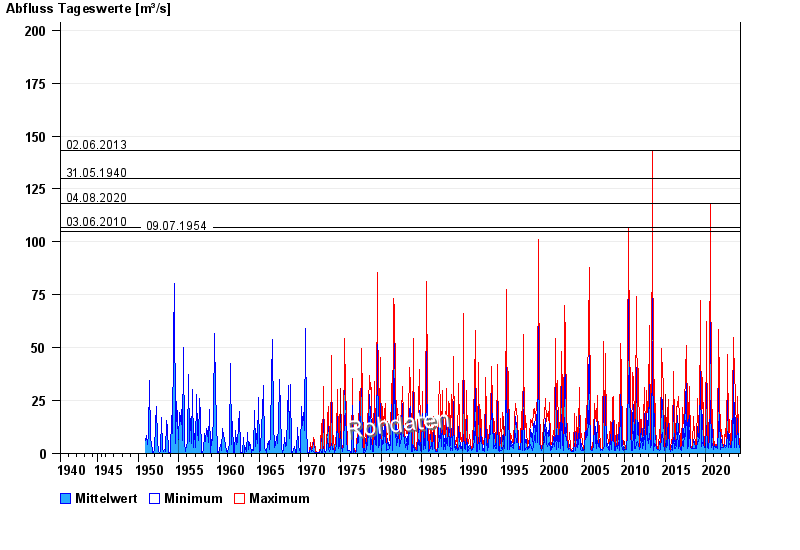
- 02.06.2013 Abfluss: 143 m³/s
- 31.05.1940 Abfluss: 130 m³/s
- 04.08.2020 Abfluss: 118 m³/s
- 03.06.2010 Abfluss: 107 m³/s
- 09.07.1954 Abfluss: 105 m³/s
| Date | Mean value [m³/s] | Maximum [m³/s] | Minimum [m³/s] |
|---|---|---|---|
| 18.04.2024 | 2.16 | 2.16 | 2.16 |
| 17.04.2024 | 2.11 | 2.16 | 1.98 |
| 16.04.2024 | 2.04 | 2.12 | 1.94 |
| 15.04.2024 | 2.11 | 2.12 | 1.94 |
| 14.04.2024 | 3.84 | 4.09 | 2.12 |
| 13.04.2024 | 2.94 | 4.09 | 1.94 |
| 12.04.2024 | 2 | 2.12 | 1.94 |
© Bayerisches Landesamt für Umwelt 2024