
- Start >
- Rivers >
- Discharge >
- Bayern >
- Donauwörth >
- Chart of year

Chart of year Donauwörth / Donau
Discharge from 01.01.2021 to 31.12.2021
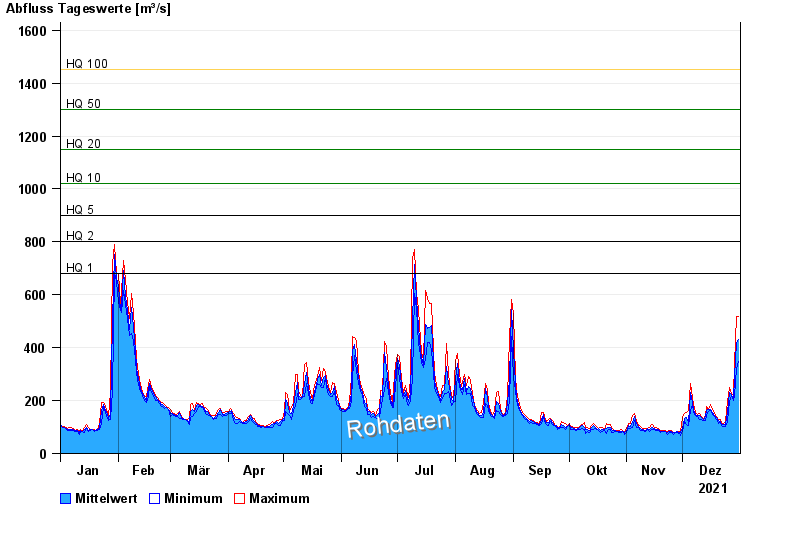
- HQ1 680 m³/s
- HQ2 800 m³/s
- HQ5 900 m³/s
- HQ10 1020 m³/s
- HQ20 1150 m³/s
- HQ50 1300 m³/s
- HQ100 1450 m³/s
| Date | Mean value [m³/s] | Maximum [m³/s] | Minimum [m³/s] |
|---|---|---|---|
| 31.12.2021 | 430 | 519 | 348 |
| 30.12.2021 | 418 | 519 | 321 |
| 29.12.2021 | 292 | 342 | 219 |
| 28.12.2021 | 206 | 220 | 201 |
| 27.12.2021 | 224 | 228 | 220 |
| 26.12.2021 | 231 | 249 | 196 |
| 25.12.2021 | 159 | 196 | 121 |
© Bayerisches Landesamt für Umwelt 2024