
- Start >
- Rivers >
- Discharge >
- Bayern >
- Dickertsmühle >
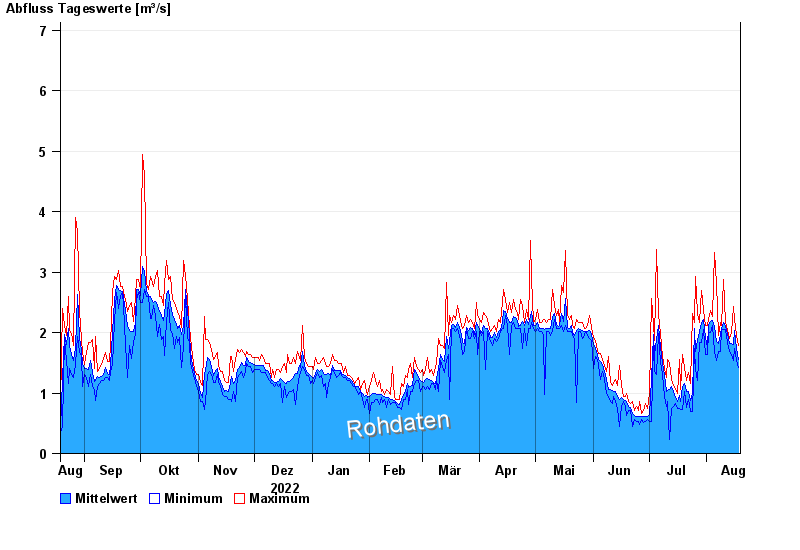
- Chart of year

Chart of year Dickertsmühle / Mühlbach
Discharge from 19.08.2022 to 18.08.2023
- 06.08.2000 Abfluss: 11,1 m³/s
- 23.06.1963 Abfluss: 9,89 m³/s
- 01.07.1954 Abfluss: 9,66 m³/s
- 01.07.1966 Abfluss: 9,05 m³/s
- 04.08.2020 Abfluss: 9,04 m³/s
| Date | Mean value [m³/s] | Maximum [m³/s] | Minimum [m³/s] |
|---|---|---|---|
| 18.08.2023 | 1.55 | 1.79 | 1.43 |
| 17.08.2023 | 1.73 | 1.95 | 1.53 |
| 16.08.2023 | 2.04 | 2.21 | 1.74 |
| 15.08.2023 | 1.8 | 2.43 | 1.53 |
| 14.08.2023 | 1.82 | 2 | 1.64 |
| 13.08.2023 | 1.82 | 1.9 | 1.69 |
| 12.08.2023 | 1.99 | 2.05 | 1.84 |
© Bayerisches Landesamt für Umwelt 2024