
- Start >
- Rivers >
- Discharge >
- Bayern >
- Dickertsmühle >
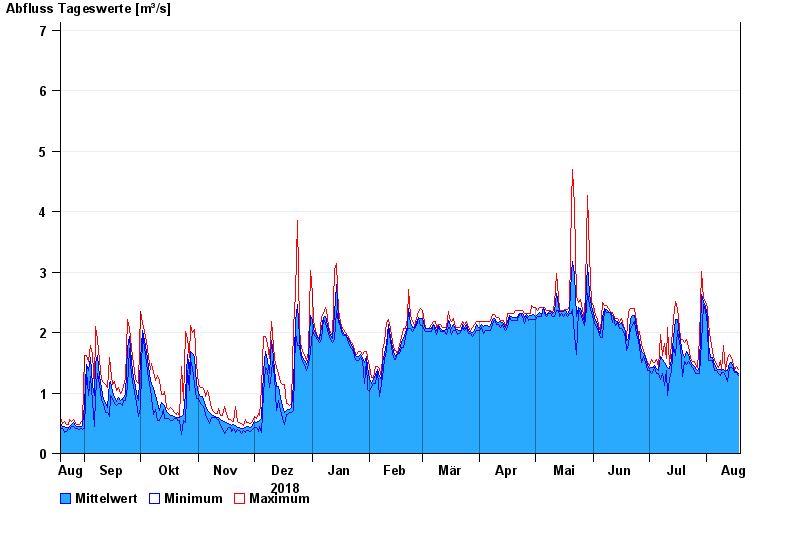
- Chart of year

Chart of year Dickertsmühle / Mühlbach
Discharge from 19.08.2018 to 18.08.2019
- 06.08.2000 Abfluss: 11,1 m³/s
- 23.06.1963 Abfluss: 9,89 m³/s
- 01.07.1954 Abfluss: 9,66 m³/s
- 01.07.1966 Abfluss: 9,05 m³/s
- 04.08.2020 Abfluss: 9,04 m³/s
| Date | Mean value [m³/s] | Maximum [m³/s] | Minimum [m³/s] |
|---|---|---|---|
| 18.08.2019 | 1.33 | 1.39 | 1.29 |
| 17.08.2019 | 1.35 | 1.44 | 1.34 |
| 16.08.2019 | 1.38 | 1.39 | 1.34 |
| 15.08.2019 | 1.43 | 1.48 | 1.39 |
| 14.08.2019 | 1.51 | 1.58 | 1.43 |
| 13.08.2019 | 1.49 | 1.63 | 1.43 |
| 12.08.2019 | 1.37 | 1.58 | 1.19 |
© Bayerisches Landesamt für Umwelt 2024