
- Start >
- Rivers >
- Discharge >
- Bayern >
- Dickertsmühle >
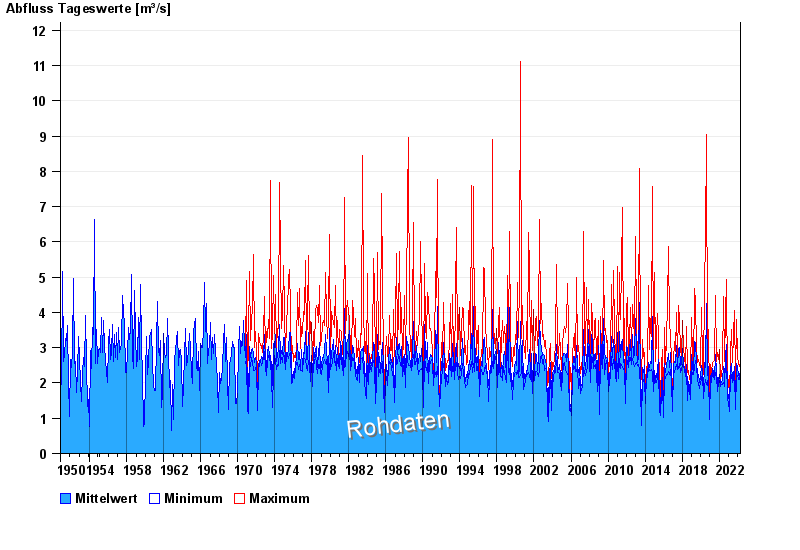
- Chart of total period

Chart of total period Dickertsmühle / Mühlbach
Discharge from 01.11.1950 to 25.04.2024
| Date | Mean value [m³/s] | Maximum [m³/s] | Minimum [m³/s] |
|---|---|---|---|
| 25.04.2024 | 2.26 | 2.26 | 2.26 |
| 24.04.2024 | 2.17 | 2.59 | 2.1 |
| 23.04.2024 | 2.17 | 2.21 | 2.16 |
| 22.04.2024 | 2.26 | 2.37 | 2.16 |
| 21.04.2024 | 2.37 | 2.48 | 2.26 |
| 20.04.2024 | 2.27 | 2.42 | 2.16 |
| 19.04.2024 | 2.12 | 2.21 | 1.24 |
© Bayerisches Landesamt für Umwelt 2024