
- Start >
- Rivers >
- Discharge >
- Bayern >
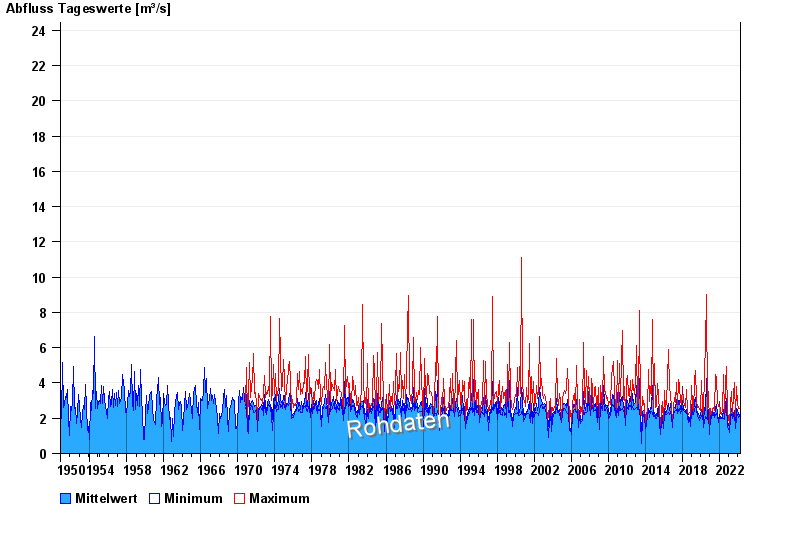
- Dickertsmühle >
- Chart of total period

Chart of total period Dickertsmühle / Mühlbach
Discharge from 01.11.1950 to 18.04.2024
 Für diesen Pegel sind keine Jährlichkeiten hinterlegt.
| Date | Mean value [m³/s] | Maximum [m³/s] | Minimum [m³/s] |
|---|---|---|---|
| 18.04.2024 | 1.88 | 2 | 1.79 |
| 17.04.2024 | 1.48 | 1.95 | 1.2 |
| 16.04.2024 | 1.34 | 1.53 | 1.2 |
| 15.04.2024 | 1.32 | 1.89 | 0.803 |
| 14.04.2024 | 1.31 | 1.95 | 0.973 |
| 13.04.2024 | 1.39 | 1.64 | 1.2 |
| 12.04.2024 | 1.53 | 1.64 | 1.39 |
© Bayerisches Landesamt für Umwelt 2024