

Chart of year Bürgstadt / Erf
Discharge from 01.01.2024 to 23.04.2024
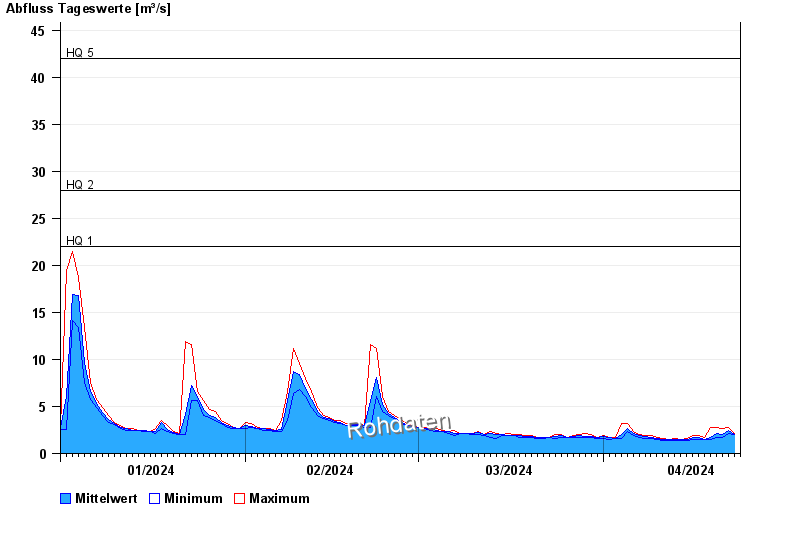
- HQ1 22 m³/s
- HQ2 28 m³/s
- HQ5 42 m³/s
- HQ10 55 m³/s
- HQ20 67 m³/s
- HQ50 86 m³/s
- HQ100 100 m³/s
| Date | Mean value [m³/s] | Maximum [m³/s] | Minimum [m³/s] |
|---|---|---|---|
| 23.04.2024 | 2.08 | 2.17 | 2.02 |
| 22.04.2024 | 2.46 | 2.79 | 2.17 |
| 21.04.2024 | 2.04 | 2.63 | 1.75 |
| 20.04.2024 | 2.15 | 2.79 | 1.75 |
| 19.04.2024 | 1.75 | 2.79 | 1.49 |
| 18.04.2024 | 1.54 | 1.75 | 1.49 |
| 17.04.2024 | 1.67 | 1.88 | 1.49 |
© Bayerisches Landesamt für Umwelt 2024