

Chart of total period Buchloe / Gennach
Discharge from 01.11.1964 to 23.04.2024
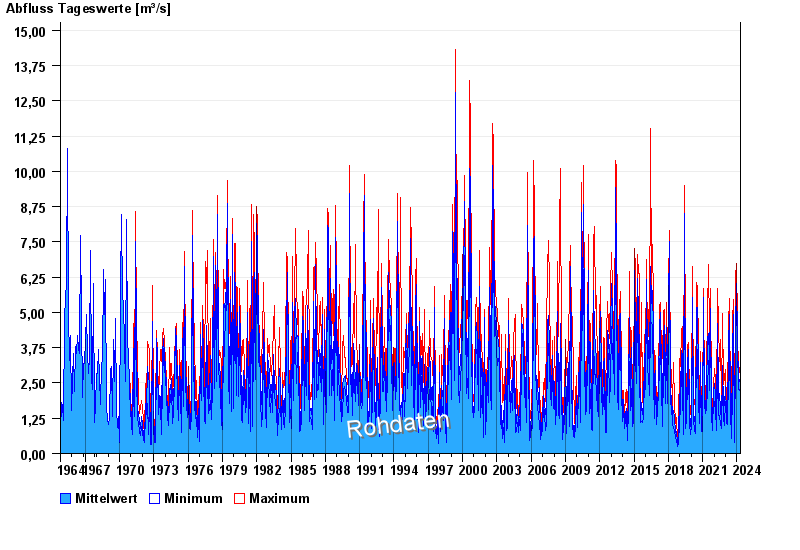
| Date | Mean value [m³/s] | Maximum [m³/s] | Minimum [m³/s] |
|---|---|---|---|
| 23.04.2024 | 1.86 | 1.9 | 1.79 |
| 22.04.2024 | 2.13 | 2.27 | 1.9 |
| 21.04.2024 | 2.15 | 2.27 | 1.9 |
| 20.04.2024 | 2.5 | 2.65 | 2.15 |
| 19.04.2024 | 2 | 2.27 | 1.79 |
| 18.04.2024 | 1.68 | 2.15 | 1.46 |
| 17.04.2024 | 1.4 | 1.79 | 1.02 |
© Bayerisches Landesamt für Umwelt 2024