

Chart of total period Buchloe / Gennach
Discharge from 01.11.1964 to 25.04.2024
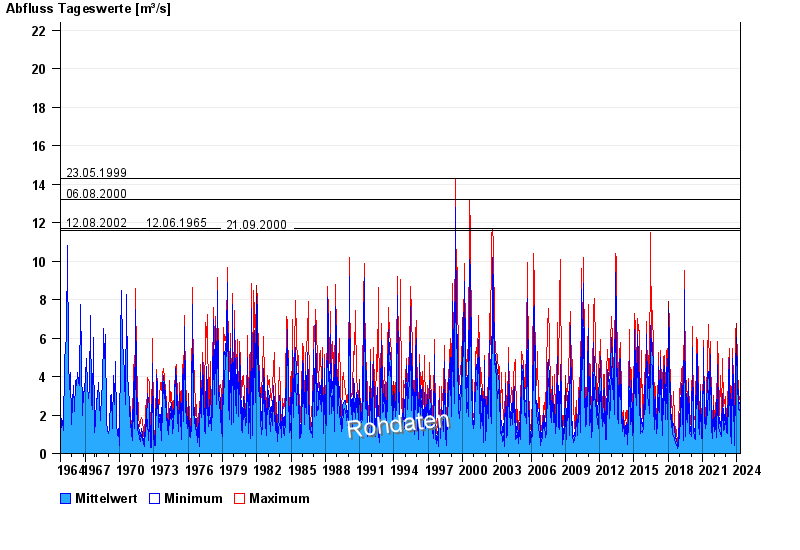
- 23.05.1999 Abfluss: 14,3 m³/s
- 06.08.2000 Abfluss: 13,2 m³/s
- 12.08.2002 Abfluss: 11,7 m³/s
- 12.06.1965 Abfluss: 11,7 m³/s
- 21.09.2000 Abfluss: 11,6 m³/s
| Date | Mean value [m³/s] | Maximum [m³/s] | Minimum [m³/s] |
|---|---|---|---|
| 25.04.2024 | 1.73 | 1.9 | 1.67 |
| 24.04.2024 | 1.77 | 1.9 | 1.67 |
| 23.04.2024 | 1.85 | 1.9 | 1.79 |
| 22.04.2024 | 2.13 | 2.27 | 1.9 |
| 21.04.2024 | 2.15 | 2.27 | 1.9 |
| 20.04.2024 | 2.5 | 2.65 | 2.15 |
| 19.04.2024 | 2 | 2.27 | 1.79 |
© Bayerisches Landesamt für Umwelt 2024