
- Start >
- Rivers >
- Discharge >
- Bayern >
- Brodhausen >
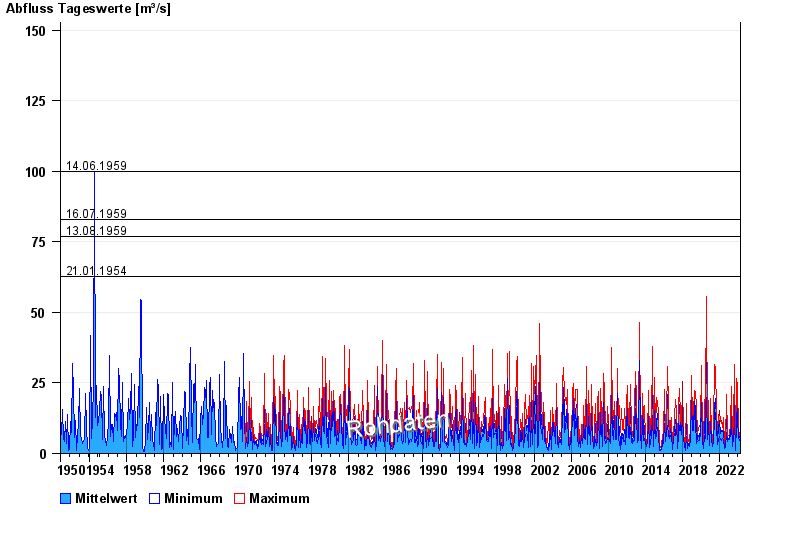
- Chart of total period

Chart of total period Brodhausen / Sur
Discharge from 01.11.1950 to 24.04.2024
note
Zeitweise Beeinflussung der Daten durch Surspeichersteuerung möglich.
- 08.07.1954 Abfluss: 180 m³/s
- 14.06.1959 Abfluss: 100 m³/s
- 16.07.1959 Abfluss: 83 m³/s
- 13.08.1959 Abfluss: 77 m³/s
- 21.01.1954 Abfluss: 62,6 m³/s
| Date | Mean value [m³/s] | Maximum [m³/s] | Minimum [m³/s] |
|---|---|---|---|
| 24.04.2024 | 4.31 | 4.35 | 4.21 |
| 23.04.2024 | 4.22 | 4.51 | 4.07 |
| 22.04.2024 | 5.03 | 5.41 | 4.51 |
| 21.04.2024 | 4.7 | 4.95 | 4.35 |
| 20.04.2024 | 4.24 | 4.66 | 3.09 |
| 19.04.2024 | 2.08 | 2.96 | 1.95 |
| 18.04.2024 | 2.23 | 2.57 | 2.07 |
© Bayerisches Landesamt für Umwelt 2024