

Chart of year Bernau / Bernauer Ache
Discharge from 01.01.2024 to 19.04.2024
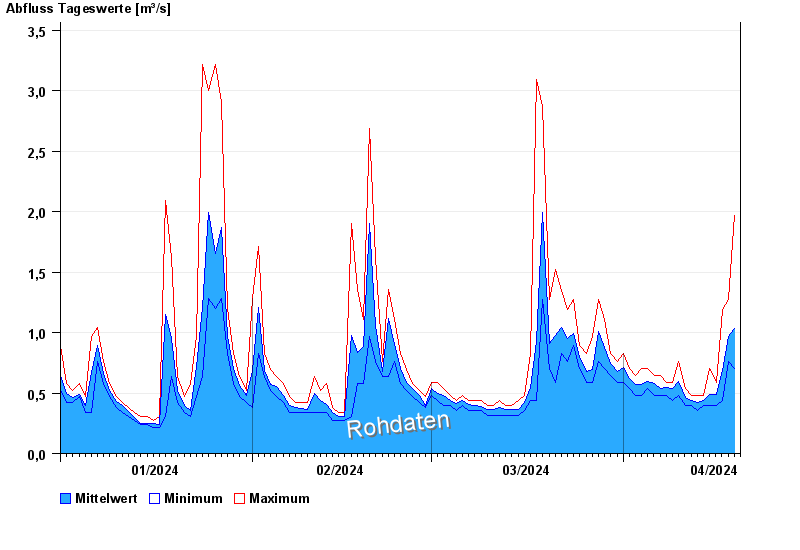
| Date | Mean value [m³/s] | Maximum [m³/s] | Minimum [m³/s] |
|---|---|---|---|
| 19.04.2024 | 0.955 | 1.19 | 0.826 |
| 18.04.2024 | 0.97 | 1.27 | 0.762 |
| 17.04.2024 | 0.687 | 1.19 | 0.437 |
| 16.04.2024 | 0.491 | 0.584 | 0.393 |
| 15.04.2024 | 0.491 | 0.7 | 0.393 |
| 14.04.2024 | 0.436 | 0.483 | 0.393 |
| 13.04.2024 | 0.419 | 0.483 | 0.353 |
© Bayerisches Landesamt für Umwelt 2024