

Chart of total period Bernau / Bernauer Ache
Discharge from 20.09.2005 to 23.04.2024
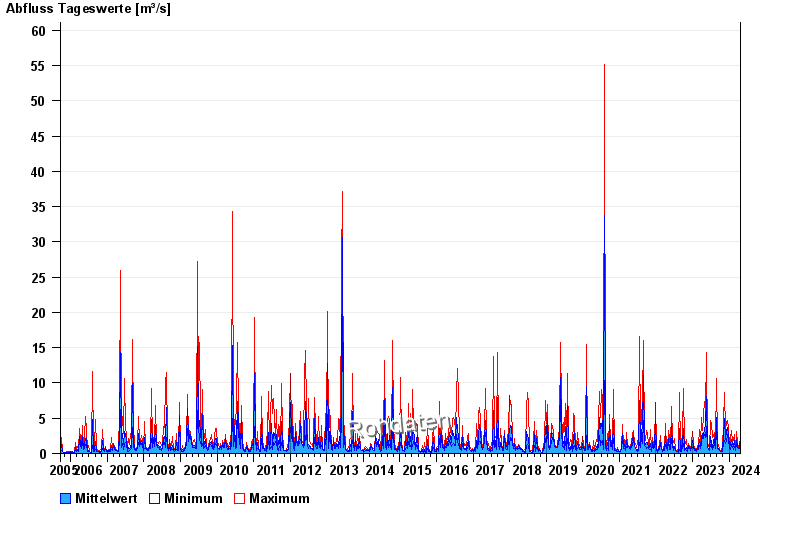
| Date | Mean value [m³/s] | Maximum [m³/s] | Minimum [m³/s] |
|---|---|---|---|
| 23.04.2024 | 1.13 | 1.27 | 0.964 |
| 22.04.2024 | 1.44 | 1.88 | 1.19 |
| 21.04.2024 | 1.95 | 2.26 | 1.61 |
| 20.04.2024 | 1.83 | 2.26 | 1.44 |
| 19.04.2024 | 1.03 | 1.97 | 0.7 |
| 18.04.2024 | 0.97 | 1.27 | 0.762 |
| 17.04.2024 | 0.687 | 1.19 | 0.437 |
© Bayerisches Landesamt für Umwelt 2024