

Chart of total period Bergen / Weiße Ache
Discharge from 14.01.1956 to 23.04.2024
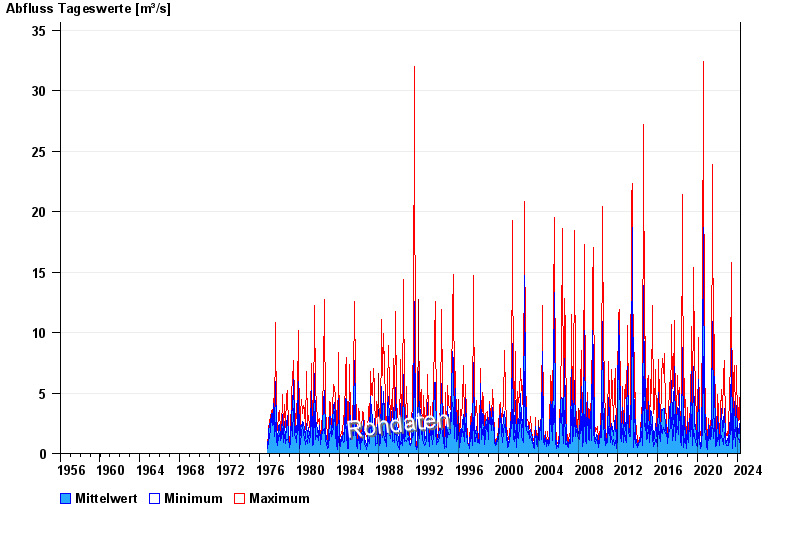
| Date | Mean value [m³/s] | Maximum [m³/s] | Minimum [m³/s] |
|---|---|---|---|
| 23.04.2024 | 0.47 | 0.53 | 0.415 |
| 22.04.2024 | 0.549 | 0.596 | 0.53 |
| 21.04.2024 | 0.593 | 0.596 | 0.53 |
| 20.04.2024 | 0.718 | 0.804 | 0.596 |
| 19.04.2024 | 0.505 | 0.732 | 0.415 |
| 18.04.2024 | 0.475 | 0.596 | 0.415 |
| 17.04.2024 | 0.365 | 0.53 | 0.273 |
© Bayerisches Landesamt für Umwelt 2024