

Chart of total period Bergen / Weiße Ache
Discharge from 14.01.1956 to 20.04.2024
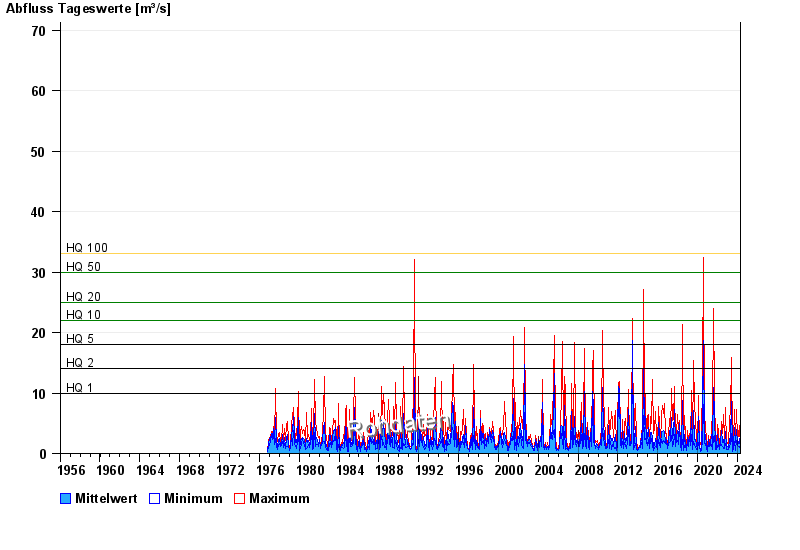
- HQ1 10 m³/s
- HQ2 14 m³/s
- HQ5 18 m³/s
- HQ10 22 m³/s
- HQ20 25 m³/s
- HQ50 30 m³/s
- HQ100 33 m³/s
| Date | Mean value [m³/s] | Maximum [m³/s] | Minimum [m³/s] |
|---|---|---|---|
| 20.04.2024 | 0.8 | 0.804 | 0.732 |
| 19.04.2024 | 0.557 | 0.732 | 0.471 |
| 18.04.2024 | 0.475 | 0.596 | 0.415 |
| 17.04.2024 | 0.365 | 0.53 | 0.273 |
| 16.04.2024 | 0.273 | 0.315 | 0.235 |
| 15.04.2024 | 0.28 | 0.362 | 0.127 |
| 14.04.2024 | 0.273 | 0.273 | 0.273 |
© Bayerisches Landesamt für Umwelt 2024