

Chart of year Bayreuth / Roter Main
Discharge from 01.01.2024 to 16.04.2024
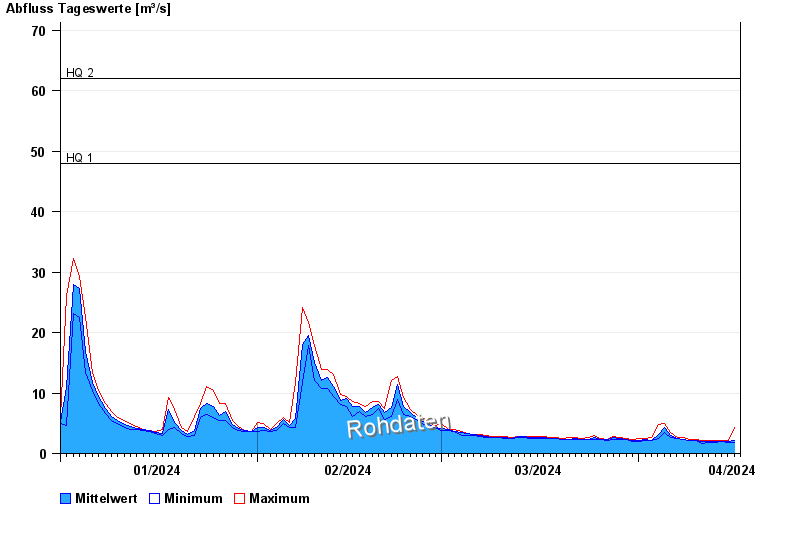
- HQ1 48 m³/s
- HQ2 62 m³/s
- HQ5 78 m³/s
- HQ10 95 m³/s
- HQ20 110 m³/s
- HQ50 135 m³/s
- HQ100 155 m³/s
| Date | Mean value [m³/s] | Maximum [m³/s] | Minimum [m³/s] |
|---|---|---|---|
| 16.04.2024 | 1.85 | 1.93 | 1.77 |
| 15.04.2024 | 1.92 | 2.1 | 1.77 |
| 14.04.2024 | 1.94 | 2.1 | 1.93 |
| 13.04.2024 | 1.95 | 2.1 | 1.77 |
| 12.04.2024 | 1.95 | 2.1 | 1.77 |
| 11.04.2024 | 1.99 | 2.1 | 1.61 |
| 10.04.2024 | 2.11 | 2.27 | 2.1 |
© Bayerisches Landesamt für Umwelt 2024