

Chart of year Bärenthal / Trubach
Discharge from 01.01.2024 to 31.12.2024
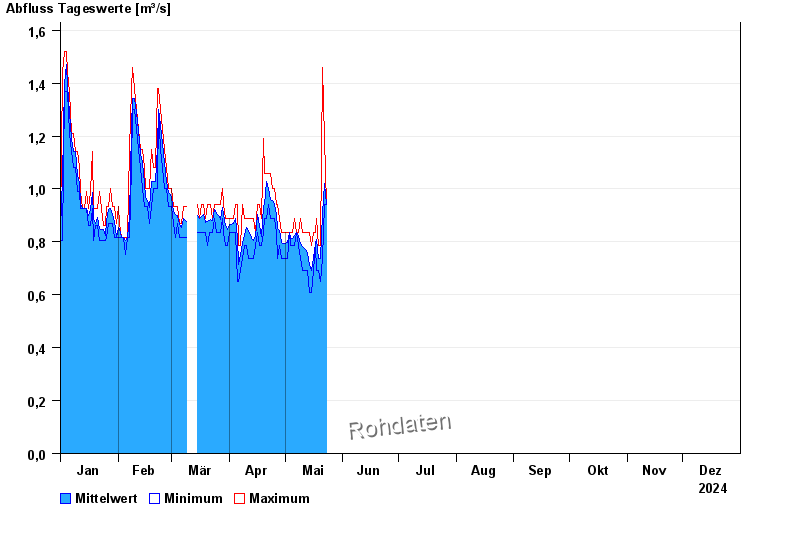
| Date | Mean value [m³/s] | Maximum [m³/s] | Minimum [m³/s] |
|---|---|---|---|
| 31.12.2024 | 0.691 | 0.732 | 0.685 |
| 30.12.2024 | 0.729 | 0.784 | 0.685 |
| 29.12.2024 | 0.763 | 0.784 | 0.732 |
| 28.12.2024 | 0.784 | 0.784 | 0.784 |
| 27.12.2024 | 0.785 | 0.834 | 0.784 |
| 26.12.2024 | 0.784 | 0.784 | 0.784 |
| 25.12.2024 | 0.784 | 0.784 | 0.784 |
© Bayerisches Landesamt für Umwelt 2025