
- Start >
- Rivers >
- Discharge >
- Bayern >
- Bad Aibling >
- Chart of year

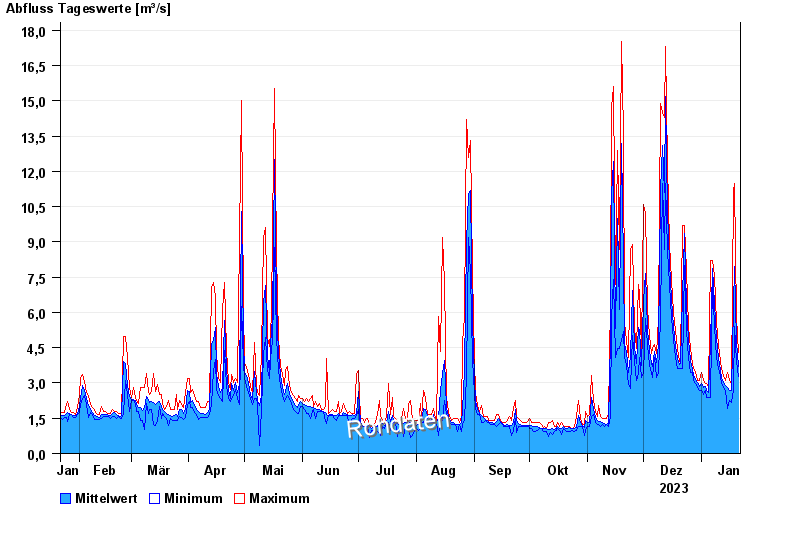
Chart of year Bad Aibling / Glonn
Discharge from 22.01.2023 to 21.01.2024
| Date | Mean value [m³/s] | Maximum [m³/s] | Minimum [m³/s] |
|---|---|---|---|
| 21.01.2024 | 3.68 | 4.28 | 3.27 |
| 20.01.2024 | 4.77 | 5.79 | 3.93 |
| 19.01.2024 | 7.96 | 11.5 | 5.4 |
| 18.01.2024 | 6.27 | 11.2 | 2.67 |
| 17.01.2024 | 2.68 | 2.96 | 2.15 |
| 16.01.2024 | 2.66 | 3.11 | 2.27 |
| 15.01.2024 | 2.8 | 3.43 | 1.92 |
© Bayerisches Landesamt für Umwelt 2024