
- Start >
- Rivers >
- Discharge >
- Bayern >
- Bad Aibling >
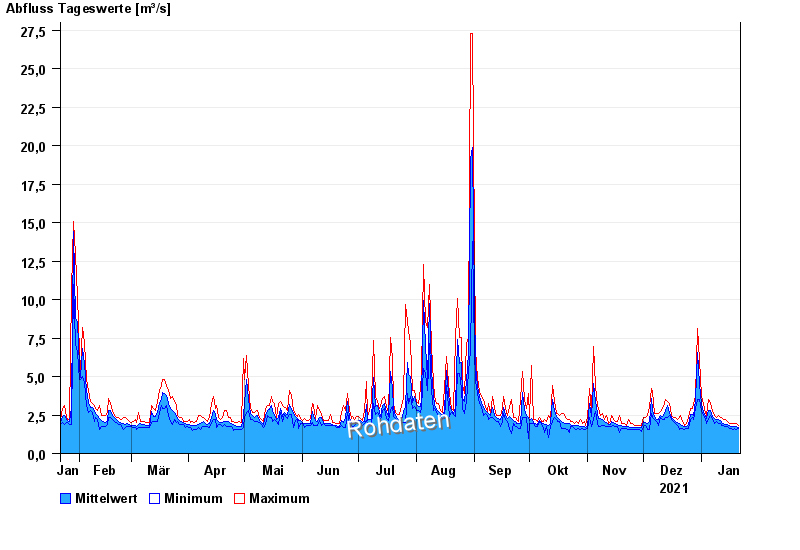
- Chart of year

Chart of year Bad Aibling / Glonn
Discharge from 22.01.2021 to 21.01.2022
| Date | Mean value [m³/s] | Maximum [m³/s] | Minimum [m³/s] |
|---|---|---|---|
| 21.01.2022 | 1.72 | 1.85 | 1.64 |
| 20.01.2022 | 1.75 | 1.96 | 1.55 |
| 19.01.2022 | 1.76 | 1.96 | 1.64 |
| 18.01.2022 | 1.77 | 1.96 | 1.55 |
| 17.01.2022 | 1.78 | 1.96 | 1.64 |
| 16.01.2022 | 1.8 | 1.96 | 1.64 |
| 15.01.2022 | 1.86 | 2.08 | 1.74 |
© Bayerisches Landesamt für Umwelt 2024