

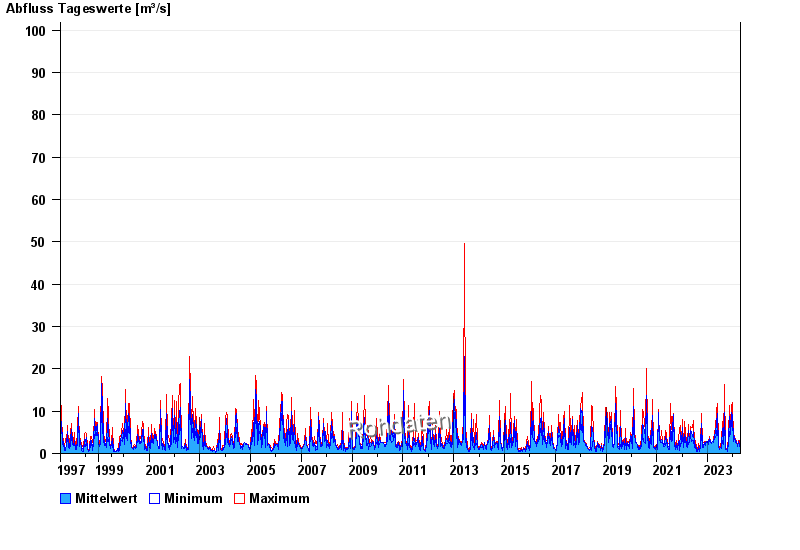
Chart of total period Ammerberg / Sur
Discharge from 07.07.1997 to 18.04.2024
 Für diesen Pegel sind keine Jährlichkeiten hinterlegt.
| Date | Mean value [m³/s] | Maximum [m³/s] | Minimum [m³/s] |
|---|---|---|---|
| 18.04.2024 | 1.66 | 1.74 | 1.62 |
| 17.04.2024 | 1.29 | 1.74 | 0.963 |
| 16.04.2024 | 1.03 | 1.15 | 0.963 |
| 15.04.2024 | 0.996 | 1.26 | 0.737 |
| 14.04.2024 | 0.987 | 1.05 | 0.963 |
| 13.04.2024 | 1.05 | 1.05 | 0.963 |
| 12.04.2024 | 1.05 | 1.05 | 1.05 |
© Bayerisches Landesamt für Umwelt 2024