
- Start >
- Rivers >
- Chemistry >
- Untere Donau >
- Messstation Pfelling >
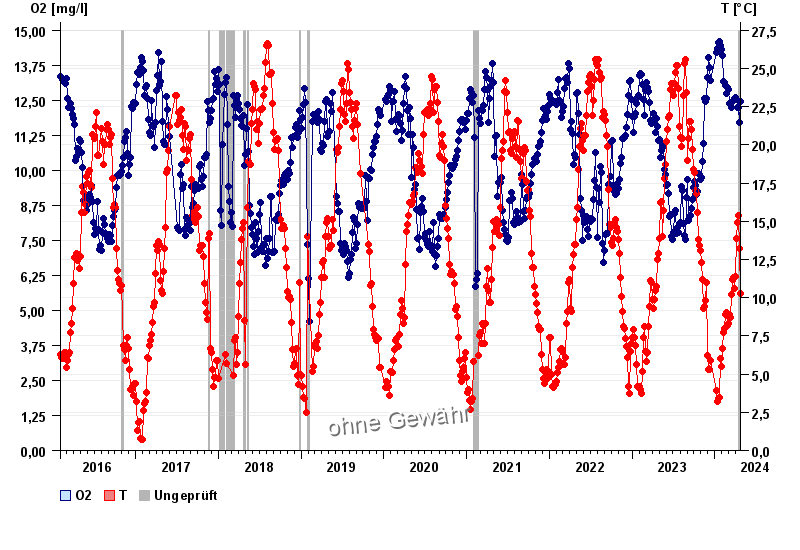
- Chart of total period

Chart of total period Messstation Pfelling / Donau
Data from 2016-02-04 to 2024-04-24
| Date | O2 [mg/l] | T [°C] |
|---|---|---|
| 24.04.2024 | 12.16 | 9.6 |
| 23.04.2024 | 12.25 | 9.9 |
| 22.04.2024 | 12.03 | 10.3 |
| 21.04.2024 | 11.72 | 10.9 |
| 20.04.2024 | 11.35 | 11.5 |
| 19.04.2024 | 11.23 | 12.5 |
| 18.04.2024 | 11.13 | 13.2 |
© Bayerisches Landesamt für Umwelt 2024