
- Start >
- Rivers >
- Chemistry >
- Unterer Main >
- Messstation Erlabrunn >
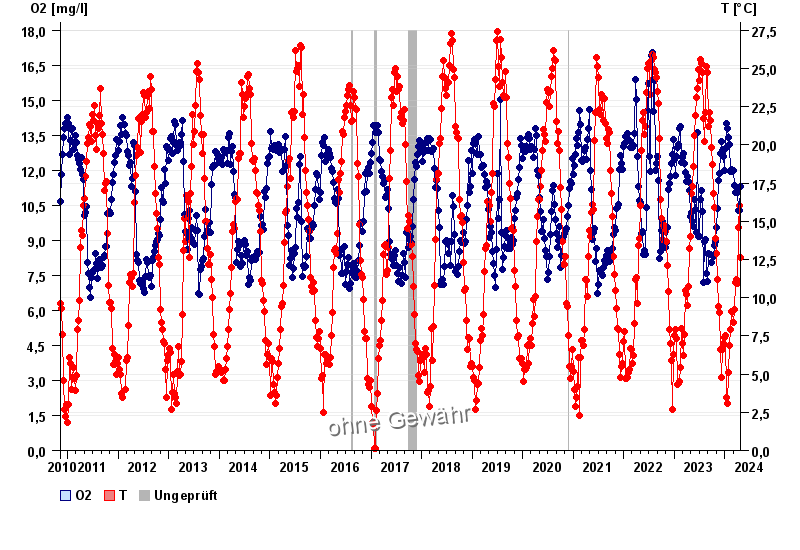
- Chart of total period

Chart of total period Messstation Erlabrunn / Main
Data from 2010-11-10 to 2024-04-23
| Date | O2 [mg/l] | T [°C] |
|---|---|---|
| 23.04.2024 | 11.11 | 10.4 |
| 22.04.2024 | 10.89 | 11.1 |
| 21.04.2024 | 10.41 | 11.9 |
| 20.04.2024 | 10.34 | 12.6 |
| 19.04.2024 | 10.24 | 13.1 |
| 18.04.2024 | 10.26 | 13.7 |
| 17.04.2024 | 10.06 | 14.5 |
© Bayerisches Landesamt für Umwelt 2024