
- Start >
- Rivers >
- Chemistry >
- Bayern >
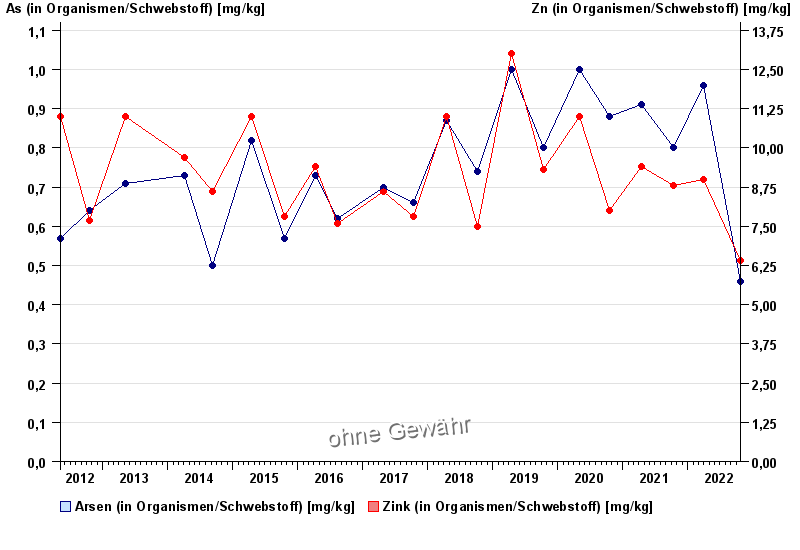
- Pegel Burgkirchen; Fkm15,4 >
- Chart of total period

Chart of total period Pegel Burgkirchen; Fkm15,4 / Alz
Data from 2012-05-08 to 2022-10-25
| Date | As (in Organismen/Schwebstoff) [mg/kg] | Zn (in Organismen/Schwebstoff) [mg/kg] |
|---|---|---|
| 25.10.2022 | 0.46 | 6.4 |
| 29.03.2022 | 0.96 | 9 |
| 12.10.2021 | 0.8 | 8.8 |
| 19.04.2021 | 0.91 | 9.4 |
| 19.10.2020 | 0.88 | 8 |
| 04.05.2020 | 1 | 11 |
| 15.10.2019 | 0.8 | 9.3 |
© Bayerisches Landesamt für Umwelt 2024