
- Start >
- Meteorology >
- Precipitation >
- Unterer Main >
- Windsheim, Bad >
- Chart of total period

Chart of total period Windsheim, Bad
Precipitation from 01.01.1961 to 17.04.2024
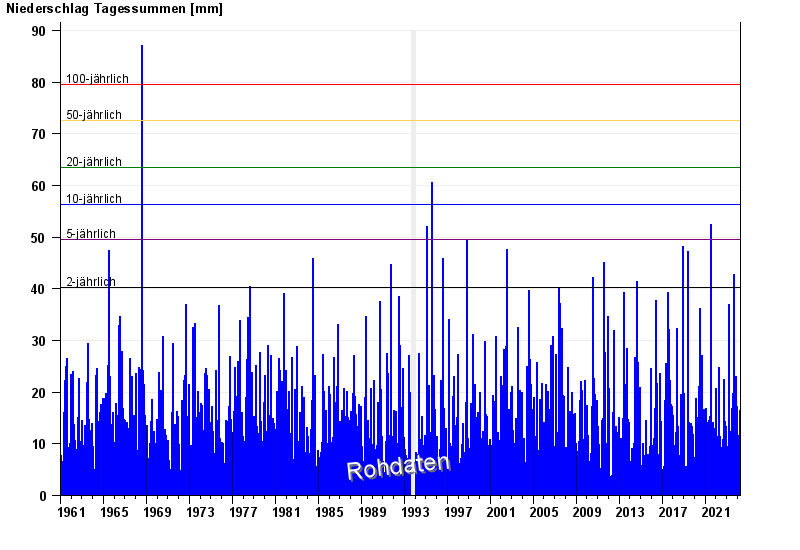
Note: The time series in the selected period has gaps.
| Date | Precipitation [mm] |
|---|---|
| 17.04.2024 | 1.9 |
| 16.04.2024 | 6.8 |
| 15.04.2024 | 3.5 |
| 14.04.2024 | 1.4 |
| 13.04.2024 | 0.0 |
| 12.04.2024 | 0.0 |
| 11.04.2024 | 0.0 |
© Bayerisches Landesamt für Umwelt 2024