
- Start >
- Meteorology >
- Global radiation >
- Regnitz >
- Gaibach-Kapellenberg >
- Chart of total period

Chart of total period Gaibach-Kapellenberg
Global radiation from 17.07.2012 to 25.04.2024
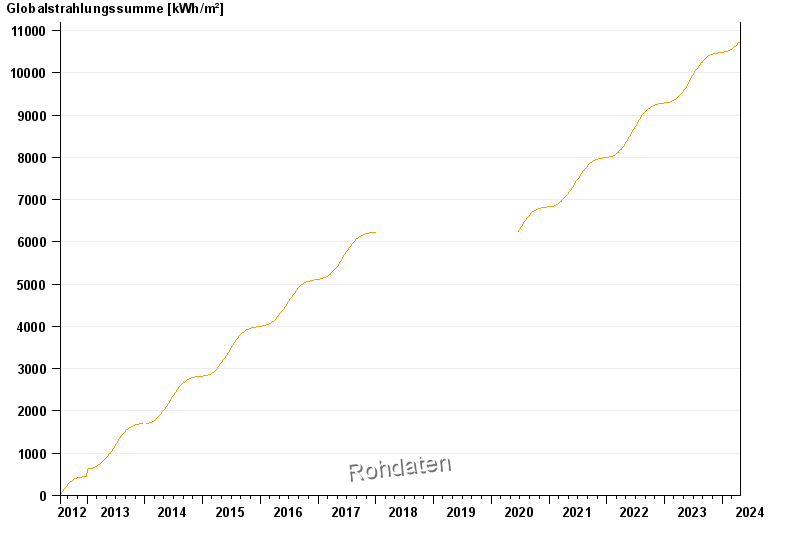
Note: The time series in the selected period has gaps.
| Date | Global radiation [Wh/m²] |
|---|---|
| 25.04.2024 | 4053.2 |
| 24.04.2024 | 2697.4 |
| 23.04.2024 | 7550.2 |
| 22.04.2024 | 5275.9 |
| 21.04.2024 | 1272.0 |
| 20.04.2024 | 4146.2 |
| 19.04.2024 | 1153.3 |
© Bayerisches Landesamt für Umwelt 2024