
- Start >
- Meteorology >
- Global radiation >
- Naab - Regen >
- Wullnhof >
- Chart of total period

Chart of total period Wullnhof
Global radiation from 05.08.1994 to 23.04.2024
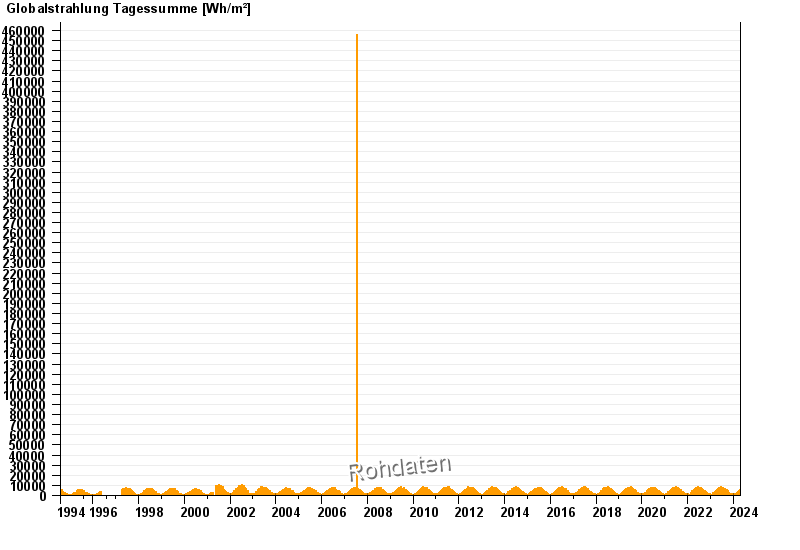
Note: The time series in the selected period has gaps.
| Date | Global radiation [Wh/m²] |
|---|---|
| 23.04.2024 | 1310.9 |
| 22.04.2024 | 5405.0 |
| 21.04.2024 | 1447.4 |
| 20.04.2024 | 3490.9 |
| 19.04.2024 | 1713.0 |
| 18.04.2024 | 2875.3 |
| 17.04.2024 | 2674.0 |
© Bayerisches Landesamt für Umwelt 2024