
- Start >
- Meteorology >
- Global radiation >
- Naab - Regen >
- Kitzenried >
- Chart of total period

Chart of total period Kitzenried
Global radiation from 01.07.1993 to 19.04.2024
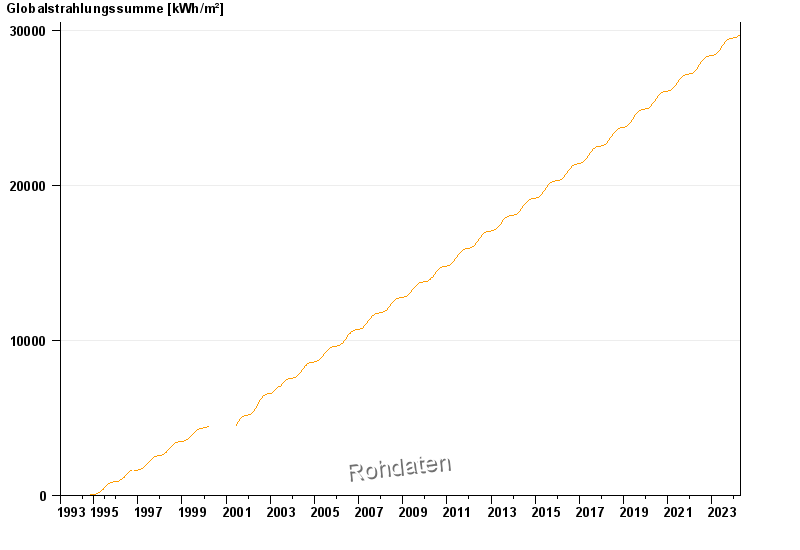
Note: The time series in the selected period has gaps.
| Date | Global radiation [Wh/m²] |
|---|---|
| 19.04.2024 | 1737.1 |
| 18.04.2024 | 2989.5 |
| 17.04.2024 | 3155.7 |
| 16.04.2024 | 1863.2 |
| 15.04.2024 | 1962.0 |
| 14.04.2024 | 4825.4 |
| 13.04.2024 | 5235.0 |
© Bayerisches Landesamt für Umwelt 2024