
- Start >
- Meteorology >
- Global radiation >
- Unterer Main >
- Schöllkrippen >
- Chart of total period

Chart of total period Schöllkrippen
Global radiation from 23.07.2010 to 20.04.2024
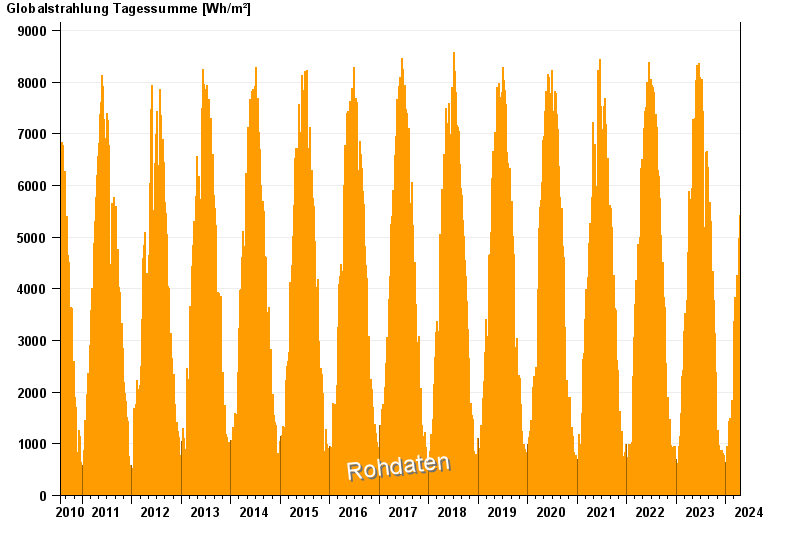
Note: The time series in the selected period has gaps.
| Date | Global radiation [Wh/m²] |
|---|---|
| 20.04.2024 | 2531.4 |
| 19.04.2024 | 666.9 |
| 18.04.2024 | 3722.3 |
| 17.04.2024 | 3684.5 |
| 16.04.2024 | 1203.9 |
| 15.04.2024 | 3542.5 |
| 14.04.2024 | 4906.4 |
© Bayerisches Landesamt für Umwelt 2024