
- Start >
- Meteorology >
- Global radiation >
- Unterer Main >
- Maria-Bildh >
- Chart of total period

Chart of total period Maria-Bildh
Global radiation from 16.09.1994 to 24.04.2024
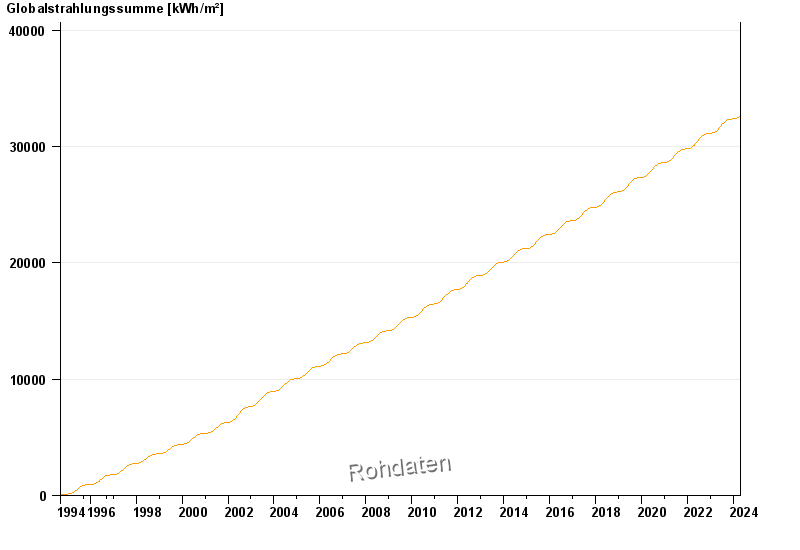
Note: The time series in the selected period has gaps.
| Date | Global radiation [Wh/m²] |
|---|---|
| 24.04.2024 | 3188.7 |
| 23.04.2024 | 6956.9 |
| 22.04.2024 | 4587.2 |
| 21.04.2024 | 1809.7 |
| 20.04.2024 | 4450.7 |
| 19.04.2024 | 1824.7 |
| 18.04.2024 | 4691.6 |
© Bayerisches Landesamt für Umwelt 2024