
- Start >
- Meteorology >
- Global radiation >
- Unterer Main >
- Bischbrunn >
- Chart of year

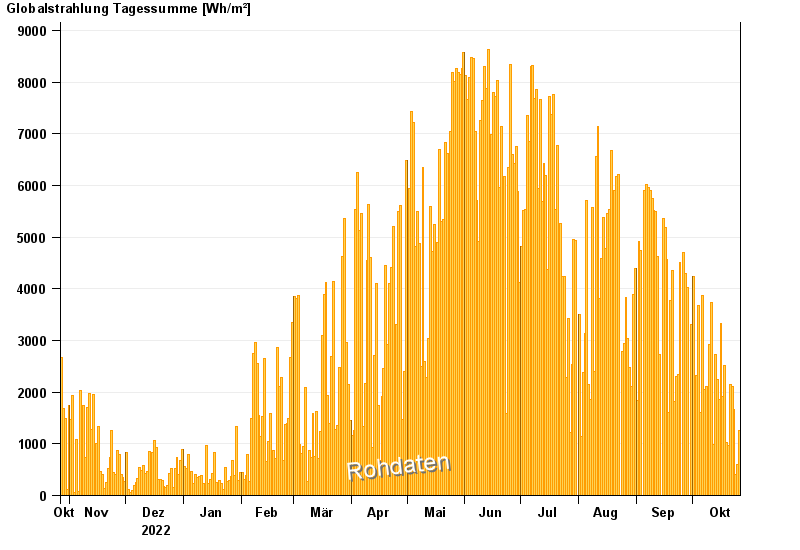
Chart of year Bischbrunn
Global radiation from 27.10.2022 to 26.10.2023
Note: The time series in the selected period has gaps.
| Date | Global radiation [Wh/m²] |
|---|---|
| 26.10.2023 | 1251.0 |
| 25.10.2023 | 598.5 |
| 24.10.2023 | 400.8 |
| 23.10.2023 | 1663.0 |
| 22.10.2023 | 2101.5 |
| 21.10.2023 | 2152.3 |
| 20.10.2023 | 961.7 |
© Bayerisches Landesamt für Umwelt 2024