
- Start >
- Meteorology >
- Global radiation >
- Obere Donau >
- Wallerstein >
- Chart of total period

Chart of total period Wallerstein
Global radiation from 22.05.2007 to 20.05.2010
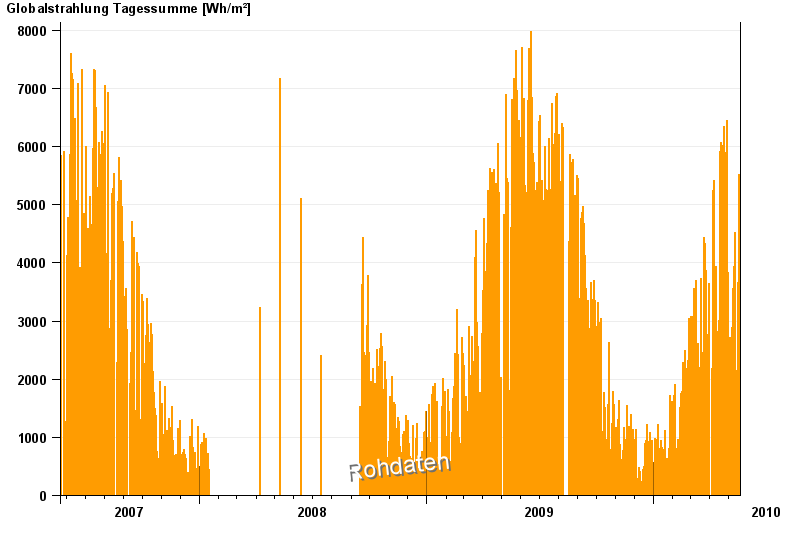
Note: The time series in the selected period has gaps.
| Date | Global radiation [Wh/m²] |
|---|---|
| 20.05.2010 | 573.8 |
| 19.05.2010 | 1971.8 |
| 18.05.2010 | 2835.8 |
| 17.05.2010 | 5531.0 |
| 16.05.2010 | 3668.7 |
| 15.05.2010 | 1849.6 |
| 14.05.2010 | 1394.6 |
© Bayerisches Landesamt für Umwelt 2024