
- Start >
- Meteorology >
- Global radiation >
- Obere Donau >
- Sandharlanden >
- Chart of total period

Chart of total period Sandharlanden
Global radiation from 21.02.1999 to 23.04.2024
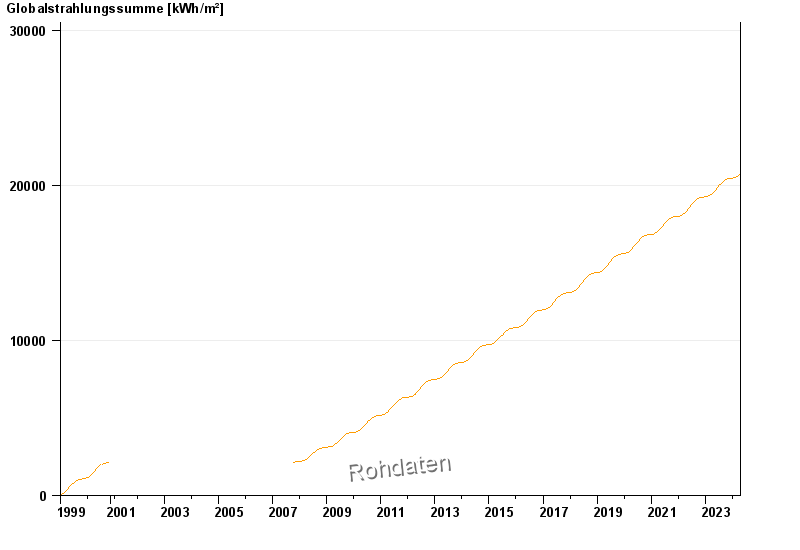
Note: The time series in the selected period has gaps.
| Date | Global radiation [Wh/m²] |
|---|---|
| 23.04.2024 | 1081.1 |
| 22.04.2024 | 5301.0 |
| 21.04.2024 | 1537.4 |
| 20.04.2024 | 2838.6 |
| 19.04.2024 | 1674.7 |
| 18.04.2024 | 2779.8 |
| 17.04.2024 | 2512.2 |
© Bayerisches Landesamt für Umwelt 2024