
- Start >
- Meteorology >
- Global radiation >
- Obere Donau >
- Puch >
- Chart of total period

Chart of total period Puch
Global radiation from 24.06.1994 to 25.04.2024
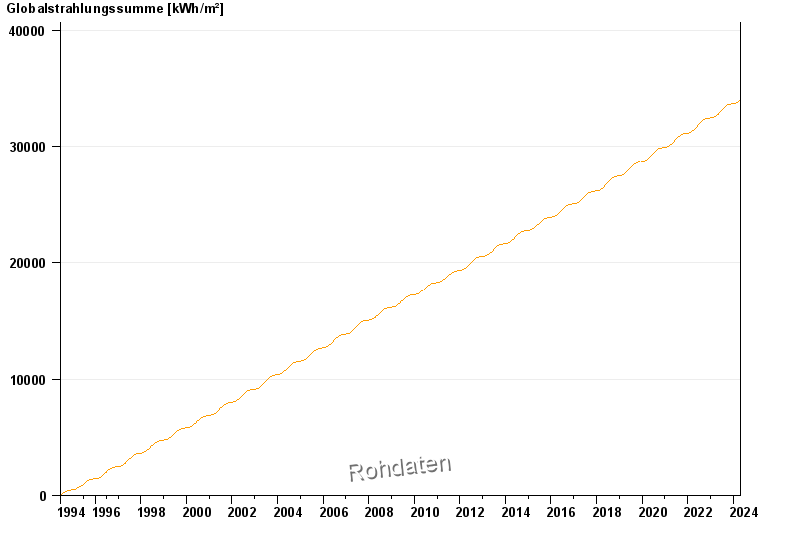
Note: The time series in the selected period has gaps.
| Date | Global radiation [Wh/m²] |
|---|---|
| 25.04.2024 | 4380.2 |
| 24.04.2024 | 4150.8 |
| 23.04.2024 | 951.3 |
| 22.04.2024 | 2619.3 |
| 21.04.2024 | 1990.3 |
| 20.04.2024 | 3103.0 |
| 19.04.2024 | 2478.7 |
© Bayerisches Landesamt für Umwelt 2024