
- Start >
- Meteorology >
- Global radiation >
- Obere Donau >
- Hepberg >
- Chart of total period

Chart of total period Hepberg
Global radiation from 24.06.1994 to 20.10.2021
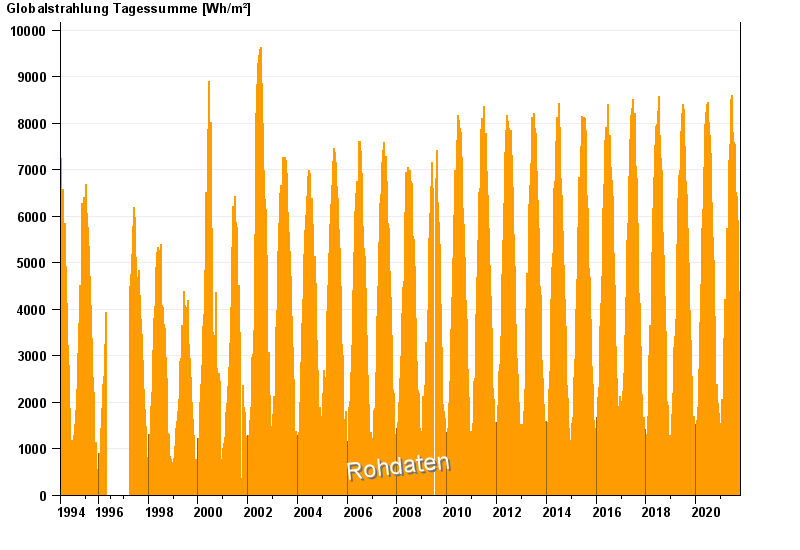
Note: The time series in the selected period has gaps.
| Date | Global radiation [Wh/m²] |
|---|---|
| 20.10.2021 | 2630.3 |
| 19.10.2021 | 909.4 |
| 18.10.2021 | 1005.8 |
| 17.10.2021 | 2001.5 |
| 16.10.2021 | 3153.6 |
| 15.10.2021 | 3146.4 |
| 14.10.2021 | 1456.7 |
© Bayerisches Landesamt für Umwelt 2024