
- Start >
- Meteorology >
- Global radiation >
- Obere Donau >
- Bischbrunn >
- Chart of total period

Chart of total period Bischbrunn
Global radiation from 10.08.2012 to 18.04.2024
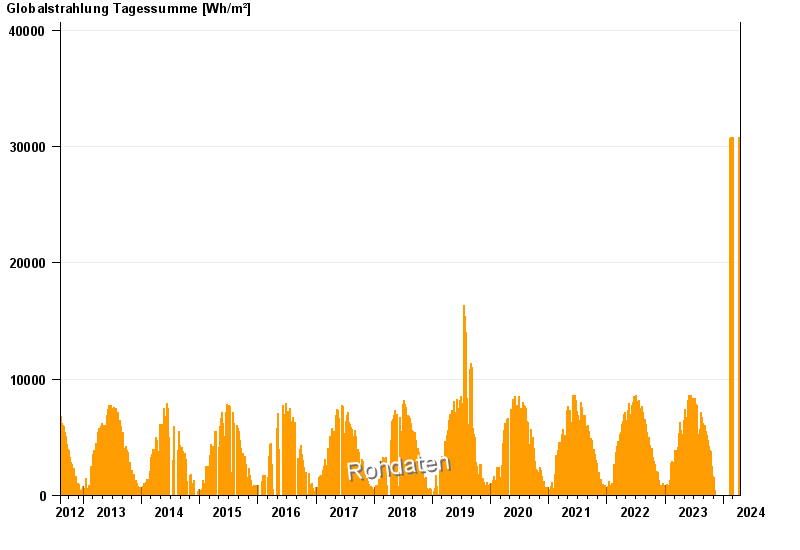
Note: The time series in the selected period has gaps.
| Date | Global radiation [Wh/m²] |
|---|---|
| 18.04.2024 | 5546.7 |
| 17.04.2024 | 30813.3 |
| 16.04.2024 | 30765.0 |
| 15.04.2024 | 30791.7 |
| 14.04.2024 | 30816.7 |
| 13.04.2024 | 30818.3 |
| 12.04.2024 | 30816.7 |
© Bayerisches Landesamt für Umwelt 2024